Fig. 2.
Download original image
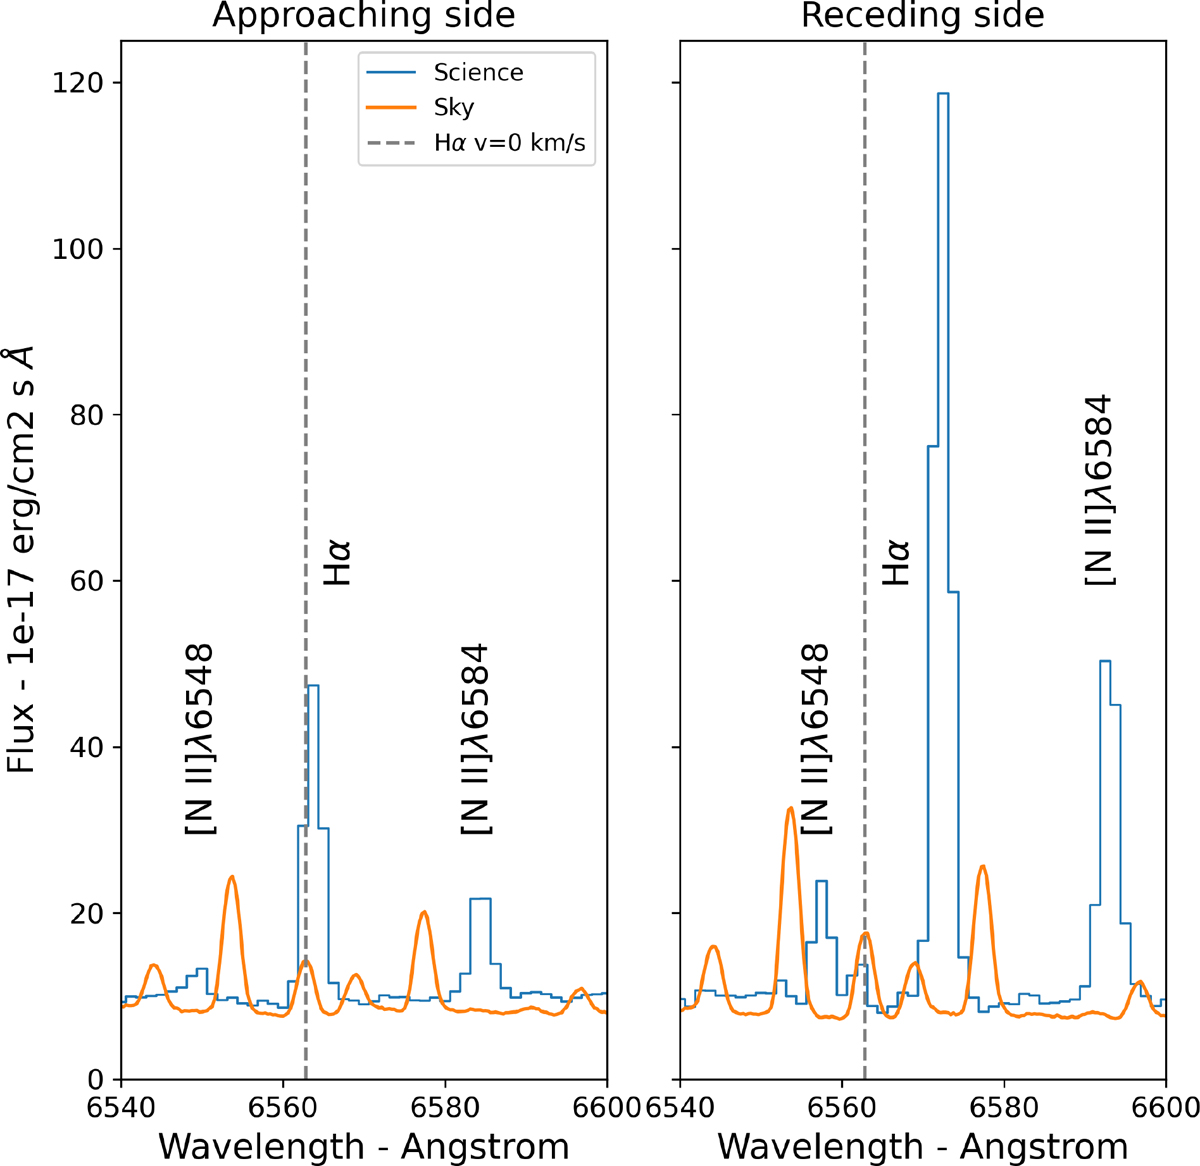
Hα region of the spectra in two different regions of the galaxy. The left panel represent the approaching side of the galaxy, and the right panel shows the receding side. In both panels we show in blue the spectrum extracted from the science exposure after our updated sky subtraction procedure, in orange the sky spectrum associated with the exposure, while the grey dashed lines represent the expected position of Hα at v = 0 km/s.
Current usage metrics show cumulative count of Article Views (full-text article views including HTML views, PDF and ePub downloads, according to the available data) and Abstracts Views on Vision4Press platform.
Data correspond to usage on the plateform after 2015. The current usage metrics is available 48-96 hours after online publication and is updated daily on week days.
Initial download of the metrics may take a while.