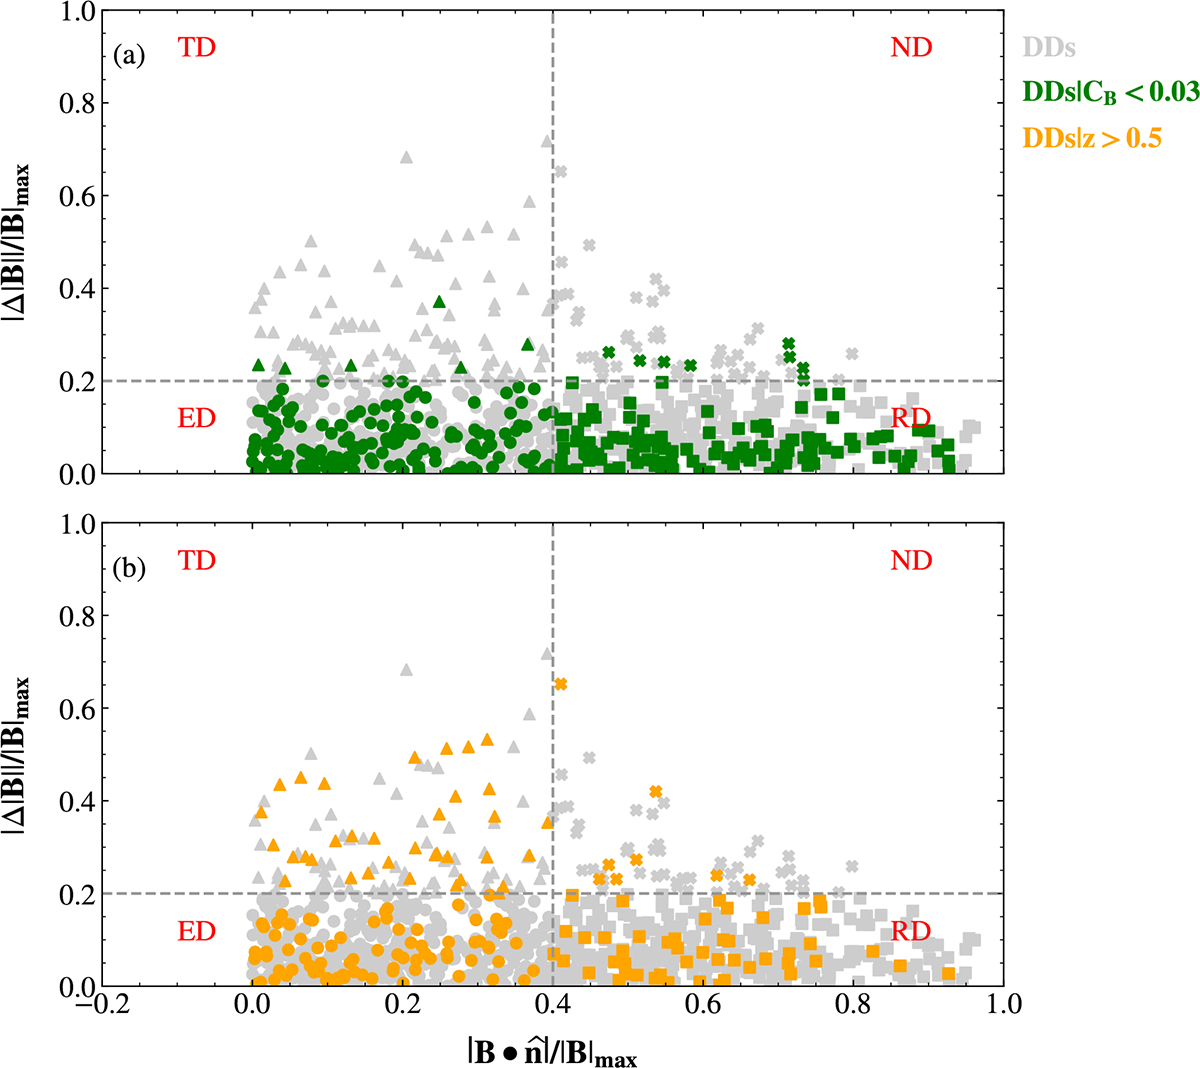
Fig. 5.
Download original image
DD classification according to Neugebauer et al. (1984). The dotted lines separate the different discontinuity areas, while grey symbols identify different types (triangles, TD; circles, ED; squares, ND; and stars, RD). Green symbols in panel (a) represent the subset of DDs satisfying the low-compressibility condition (CB < 0.03), while orange symbols in panel (b) refer to z > 0.5.
Current usage metrics show cumulative count of Article Views (full-text article views including HTML views, PDF and ePub downloads, according to the available data) and Abstracts Views on Vision4Press platform.
Data correspond to usage on the plateform after 2015. The current usage metrics is available 48-96 hours after online publication and is updated daily on week days.
Initial download of the metrics may take a while.