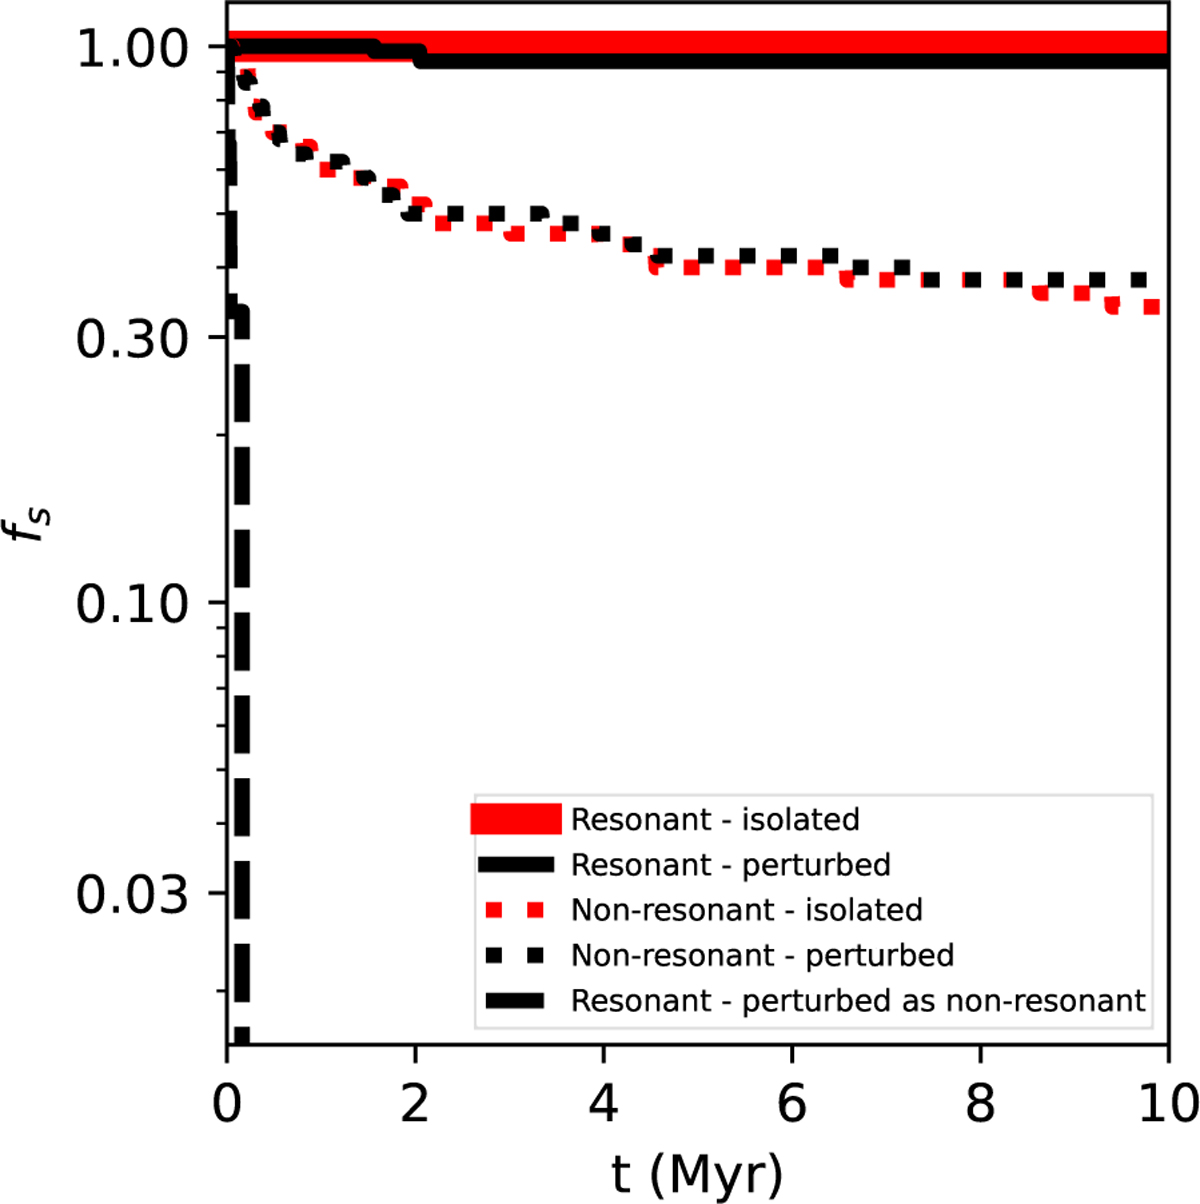
Fig. 6
Download original image
Fraction of surviving planetary systems over time (fs(t)) for PDS 70. The figure shows the isolated resonant system, the 50 perturbed resonant systems, the 50 isolated non-resonant systems, and the 50 perturbed non-resonant systems. In addition, a re-interpretation of the perturbed resonant systems that lost resonance is shown. These systems are shifted in time such that the moment they lose resonance is at t = 0. This subset constitutes three PDS 70 systems. The isolated non-resonant systems and the perturbed non-resonant systems are not distinct from each other. The perturbed resonant systems that lost resonance dissolve much faster than the non-resonant systems. Later analysis in Sect. 4, as shown in Table 1, demonstrates that the isolated resonant curve and the perturbed resonant curve do not differ significantly, since the difference between 0 and the value for λ for the perturbed resonant systems is not statistically significant.
Current usage metrics show cumulative count of Article Views (full-text article views including HTML views, PDF and ePub downloads, according to the available data) and Abstracts Views on Vision4Press platform.
Data correspond to usage on the plateform after 2015. The current usage metrics is available 48-96 hours after online publication and is updated daily on week days.
Initial download of the metrics may take a while.