| Issue |
A&A
Volume 700, August 2025
|
|
|---|---|---|
| Article Number | A83 | |
| Number of page(s) | 5 | |
| Section | Astrophysical processes | |
| DOI | https://doi.org/10.1051/0004-6361/202554257 | |
| Published online | 08 August 2025 | |
Effect of lowering gas-grain sticking coefficients on cold-core molecular abundances
1
Aix Marseille Univ, CNRS, CINaM, Marseille, France
2
Laboratoire d’Astrophysique de Bordeaux (LAB), Univ. Bordeaux, CNRS, B18N, allée Geoffroy Saint-Hilaire, 33615 Pessac, France
3
Centro de Astrobiología (CAB), CSIC-INTA, Ctra. de Ajalvir, km 4, Torrejón de Ardoz, 28850 Madrid, Spain
⋆ Corresponding authors: This email address is being protected from spambots. You need JavaScript enabled to view it.
; This email address is being protected from spambots. You need JavaScript enabled to view it.
; This email address is being protected from spambots. You need JavaScript enabled to view it.
Received:
25
February
2025
Accepted:
19
June
2025
Abstract
Context. In dense environments, such as those found in cold cores, molecules from the gas phase stick at the surface of interstellar grains upon collision. Recent laboratory studies have shown that the adsorption probability of a gas-phase species on a grain, called the sticking coefficient (SC), is lower than the commonly used value of 1. This might significantly decrease the accretion rate of ice mantles onto the surface of grains and increase gas-phase abundances.
Aims. We used the Nautilus gas-grain numerical model to assess the effects of lower sticking coefficients on the evolution over time of molecular abundances in cold cores.
Methods. We compared the chemical abundances of gas-phase CO and CH3OH between observations and model predictions, while using the sticking coefficients of 0.1, 0.3, and the standard value of 1 under cold-core conditions. Fixed and time-dependent physical conditions are assumed while the model results are compared to the observed abundances in the cold cores TMC-1, L694 and L429-C. This study combines rate equation chemical models with smoothed particle hydrodynamics (SPH) models.
Results. We find that lowering the sticking coefficient induces a temporal shift in the abundance profiles and can improve the agreement of the modeled abundances to observations. For CO, lower sticking coefficients also results in a strong decrease in the ice-to-gas ratio.
Conclusions. This work shows that it is possible to adjust the sticking coefficient toward more realistic values, and to obtain an agreement with the observed gas-phase abundances of the same quality, or even better, than with a SC of 1. However, a decrease in the SC causes the maxima of the calculated gas-phase abundances to be shifted in time.
Key words: astrochemistry / accretion / accretion disks / molecular processes / methods: analytical / ISM: abundances / dust / extinction
© The Authors 2025
 Open Access article, published by EDP Sciences, under the terms of the Creative Commons Attribution License (https://creativecommons.org/licenses/by/4.0), which permits unrestricted use, distribution, and reproduction in any medium, provided the original work is properly cited.
This article is published in open access under the Subscribe to Open model. This email address is being protected from spambots. You need JavaScript enabled to view it. to support open access publication.
1. Introduction
Understanding the evolution of the interstellar medium (ISM) requires the integration of observational, laboratory, and computational studies (Cuppen et al. 2017). To obtain a good agreement with observations, computational models require a constant improvement of the physical phenomena studied (e.g., gas-gas, gas-grain, desorption), of the rate constants of the reactions involved, and of the extent of the chemical networks involved (Agundez & Wakelam 2013). Well-simulated gas-grain interactions are essential for the modeling of the cold, dark clouds, where gas and dust coexist (e.g., Acharyya et al. 2011; Garrod et al. 2008, 2007; Ruaud et al. 2016). A key parameter in successfully modeling gas-grain interactions is the sticking coefficient (SC), which quantifies the adsorption probability of gas-phase molecules onto the surface of dust grains.
To date, all models, including the model Nautilus employed in this work, use a SC of 1 to simulate gas-grain interactions (Ruaud et al. 2016; Cuppen et al. 2013). This is supported by laboratory studies that have consistently reported experimental SC values as being 1. This is the case for H2O (Brown et al. 1996), CO, N2, O2, CH4, and CO2 (Bisschop et al. 2006; Fuchs et al. 2006; Acharyya et al. 2007; Noble et al. 2012; He et al. 2016), and for H2 and D2 at low gas temperatures (Matar et al. 2010; Chaabouni et al. 2012). However, these laboratory values were all obtained on centimetric flat substrates (metals, carbon, and silicates), bare or covered with water ice. Although the chemical compositions of these flat surfaces are similar to those of interstellar grains, they are not at all physically similar; the grains are characterized by their size (smaller than a micrometer) and rugged morphology. For more realistic studies, recent laboratory experiments have been conducted on submicrometric dust grain analogues resembling those in the ISM. They have revealed that the SC values for molecules like CO, N2, CO2, and H2O are significantly lower than 1 on such grains, ranging from 0.04 to 0.17 (Stadler et al. 2024; Laffon et al. 2021). This parallels planetary atmosphere studies, where it has long been known that small grains are less effective condensation nuclei for liquid water and ice, preventing or reducing cloud formation in the atmosphere (Dusek et al. 2006). This effect is due to morphological defects on the dust grain surface (Hoose & Möhler 2012): only the concave fraction of the rough surface of a grain is active for adsorption (Buch & Czerminski 1991; Buch & Zhang 1991; Buch et al. 1996), while on flat surfaces the entire area is equally available for adsorption. Thus, molecular adsorption per unit area on a rough surface is less effective than on a flat one.
The gas-grain interactions involving H2O, CO2, CO, and CH3OH are still challenging for astrochemical models to fully replicate (Clément et al. 2023). In this work, we primarily focus on the evolution of the abundance of CO, which is the most abundant molecule in the solid phase after water, and after molecular hydrogen in the gas phase (McClure et al. 2023). CO sticks directly onto the dust grain surface, a process mediated by the SC. CO has been shown to play a key role in the evolution of the chemistry of the interstellar medium and protoplanetary disks, both in the gas phase and as ice frozen out on dust grains (Powell et al. 2022; Öberg et al. 2009). It is also a tracer of the thermal and dynamical evolution of various structures (Jorgensen et al. 2005).
Another aspect of this study considers methanol CH3OH. This species has a far lower abundance in the interstellar medium than CO in both the gas and solid phases (Smith et al. 2004; Boogert et al. 2015), and yet it is a vital precursor to the further development of organic complexity, as a key building block of amino acids (Elsila et al. 2007). However, unlike CO, CH3OH is formed on dust grains by the successive hydrogenation of CO, (a process that dominates other solid-state routes, such as CH4+ OH, Qasim et al. 2018). It is then relevant to study the evolution of CH3OH in order to examine how a lower sticking coefficient of its precursor CO molecules hinders its formation (Wirström et al. 2011). While being formed by hydrogenation, CH3OH also desorbs due to the chemical energy created during its formation, or subsequently by the interaction of the grains with cosmic rays and photons (Garrod et al. 2007; Acharyya et al. 2011; Dartois et al. 2020). This contextualizes the formation of CH3OH as a part of the same environment as CO, but as a subsequent step in its chemical network (Garrod et al. 2007).
This work is based on the previous studies conducted by Laffon et al. (2021) and Stadler et al. (2024), where the sticking coefficient of CO on grains was measured below 0.2. Inspired by these results, values of 0.1–0.3 were used in the Nautilus simulations. They apply to all species, except for hydrogen, whose SC is fixed at 1. First, the model is presented, followed by the results obtained from static models. Finally, these results are applied to a hydrodynamic simulation, which takes several dynamical properties into account to describe the development of a cold core in time.
2. Model presentation
This study was performed using the latest version of the Nautilus open-source code as presented by Ruaud et al. (2016) and Wakelam et al. (2024). A Fortran code computes chemical abundances as a function of time for a set of physical and chemical conditions. Gas-grain reactions are modeled using the rate equation method, considering thermal diffusion (hopping) of physisorbed species and quantum tunneling over the grain mantle (Reboussin et al. 2014). It uses the Langmuir-Hinshelwood mechanism to describe the formation of molecules on the grain surface, balanced by their desorption by thermal and nonthermal processes that maintain the gas-grain equilibrium (Garrod et al. 2007; Wakelam et al. 2021). Nautilus considers the gas phase and two distinct phases for the grain mantles (three-phase modeling); the surface ice is defined as two monolayers of molecules, and the rest is the bulk of the ice below (Ruaud et al. 2016). Both are chemically active, but the surface diffusion and the bulk diffusion are treated separately with their own specific parameters.
The gas-grain chemistry initially depends on how atoms and molecules stick onto grain surface layers, as modeled by equation 1 for the accretion rate facc,A for a species A (Cuppen et al. 2017):
 (1)
(1)
Here, SCA is the sticking coefficient, υA is the average gas-phase velocity, ngrain is the number density of grains, rgrain is the grain radius, and ng(A) is the gas density of species A.
To evaluate the effect of lowering the SC, we used the test case of cold cores, representing the first step in the formation of stars, in which the sticking of gas-phase species is particularly important. In the static approach, the physical conditions in the cold core do not evolve (set to the typical conditions observed in these sources) and species are initially atomic (except for H2). The time-dependent chemistry is computed over 107 yr, and the outputs are the species abundances as a function of time. The physical parameters used for this study are presented in Table 1.
Physical parameters used.
In another model, the static approach is coupled with a hydrodynamic variant. With the hydrodynamic approach, the physical parameters are the time-dependent gas and dust temperatures, density, and visual extinctions as computed by the smoothed particle hydrodynamics (SPH) model presented in Bonnell et al. (2013). A description of these simulations and how the post-processed chemistry computation was retrieved can be found in Ruaud et al. (2018). Briefly, the SPH model computes the physical parameters as a function of time for cells of material that form the cold cores at the end of the simulations. These cells were identified and the time-dependent physical conditions retrieved. The latter were then used as inputs to the Nautilus gas–grain model that computed the time-dependent chemical abundances. Here the SC is particularly important for the transition between diffuse and dense medium. As in these simulations the gas temperature can vary between a few 100 K and 10 K, we computed in parallel the dust temperature using Hocuk et al. (2017) parameterization, which approximates this parameter as a function of the visual extinction (assuming Draine UV field strength). The cosmic-ray ionization rate was also computed as a function of visual extinction using the approximation described in Clément et al. (2023). For both fixed and time-dependent physical conditions, the gas-phase initial abundances are listed in Table 2.
Initial abundances.
In the simulations we used SC values of 0.1, 0.3, and 1 for all species of the chemical network, including CO and CH3OH. As mentioned in the Introduction, these values were derived from the study of Stadler et al. (2024) who used submicrometric olivine grains as analogs of interstellar grains, which are primarily magnesium-rich olivine grains with a low crystallinity (Min et al. 2007). For H and H2, we used the temperature-dependent sticking coefficients from Matar et al. (2010) and Chaabouni et al. (2012), which is close to 1 at 10 K. The outcomes of the models were compared to the curves obtained with the conventional SC of 1, and to the observational abundances of selected cold cores: TMC-1, L694, and L429-C. TMC-1 is a prototypical cold core located in the Taurus region. It is one of the closest star-forming regions and has been shown to contain more than 50 complex organic molecules, dominated by CO, and is well characterized (Fuente et al. 2019). L694 and L429-C are cold dark cores located in the Aquila region. L429-C, in particular, is a quiescent cold core that has shown high levels of CO depletion, as well as detections of methanol ice (Taillard et al. 2023; Clément et al. 2023). L694 is an infalling cold core that also shows advanced chemistry (Taillard et al. 2023; Chu et al. 2020).
3. Results and discussion
3.1. Static model
Figure 1 (top panel) shows the CO abundance computed using static conditions for SC values of 0.1, 0.3, and 1, for the gas phase (solid lines) and the solid phase (dashed lines). They are compared to the gas-phase abundance of CO observed in the Taurus molecular cloud (TMC-1 CP, cyanopolyyne peak) of 8.5 × 10⁻⁵/NH (gray horizontal line), plotted within their uncertainty (gray horizontal band) (Agundez & Wakelam 2013). The overall shape of the curves in Fig. 1 is the same for the three SCs studied; the abundance of CO increases to a maximum, before decreasing, both in the gas and solid phases. Compared to a SC of 1, the maximum gas-phase abundances with a SC of 0.1 are shifted in time by about 105 yr, and also remain higher for a longer time. Conversely, lower sticking coefficients reduce the abundance of CO in the solid phase. The ice-to-gas ratio also strongly decreases: at the point of maximum abundances in the gas phase, the ice-to-gas concentration is 10 times lower for a SC = 0.3 than for a SC = 1, and 500 times lower for a SC = 0.1. At late times (> 105 yr), the abundance of CO in both the gas and solid phases decreases, denoting the time at which CO formation ceases, and most of the existing CO is used to form other molecules, such as CH3OH, which depletes the CO reservoir. All the SC values investigated produced abundances that correspond to the observed abundance in TMC-1, within the errors.
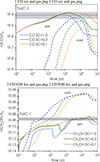 |
Fig. 1. Gas-phase and solid-phase abundances of CO (top) and CH3OH (bottom) computed as a function of time using fixed physical conditions, with a SC of 1, 0.3, and 0.1, compared with the observational gas-phase abundance of TMC-1 CP (horizontal lines). |
Figure 1 (bottom panel) shows the abundance of CH3OH as a function of time with SCs of 0.1, 0.3, and 1, for the gas phase (solid lines) and solid phase (dashed lines). They are compared to the observational gas-phase abundance of TMC-1 CP of 1.6 × 10⁻⁹/NH (Agundez & Wakelam 2013). As previously mentioned, CH3OH is formed on dust grains by the successive hydrogenation of condensed CO, increasing the solid-phase abundance of methanol with time. Therefore, the solid phase of methanol is naturally more abundant than the gas phase. The gas phase is fed because CH3OH can desorb (Clément et al. 2023; Qasim et al. 2020). Desorption can occur by the exothermicity of the last step of the reaction chain, CH3O + H (Garrod et al. 2007), or subsequently by nonthermal or sputtering desorption processes induced by cosmic rays (Hasegawa & Herbst 1993; Wakelam et al. 2021). However, desorption is balanced by recondensation on grain surfaces (Garrod et al. 2007), which is directly mediated by the sticking coefficient.
After approximately 105 yr, the abundances of both the gas and solid phases of CH3OH hold steady, denoting an equilibrium between its production and destruction; it also coincides with the time when solid CO reaches its maximum values (top panel). A lower SC results in a slightly higher abundance of gas-phase methanol, and a higher SC results in a slightly higher abundance of solid methanol. Compared to CO, the effect of SC on the computed abundances is much less pronounced. Therefore, the SC value is not a crucial parameter to properly model the maximum abundance of condensed CH3OH. Finally, in the late stages, the abundances of CH3OH in both phases begin to decrease. This is related to the decrease of CO in the solid phase, resulting in a lower concentration of solid CH3OH, and consequently a lower concentration in the gas phase due to desorption. Regarding the agreement with the observations, all of the SC values result in gas-phase CH3OH abundances that reach the observational abundance distribution.
Beyond the cases of CO and methanol, a list of 38 observed abundances has been compared to their corresponding outputs of Nautilus with the distance of disagreement (DD) method (Wakelam et al. 2006). At each time step the difference between the predicted and observed abundances are computed as:
 (2)
(2)
with Ni being the total number of considered species, and log(Xi,mod(t)) and log(Xi,obs) the modeled and observed abundances of species s,tei. The lower the value of the DD, the better the agreement.
Figure 2 shows the evolution of the DD as a function of time for the different values of the sticking coefficient. As in Fig. 1, the most notable change is temporal, where lowering the sticking coefficient shifts the time at which the best times (i.e., the lowest values of DD) for the model occur, relative to the measured TMC-1 CP abundances. Overall, the distance of disagreement for this set of 38 species is higher with a lower sticking coefficient, despite the agreement with observational abundance being individually improved for CO and CH3OH.
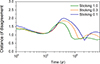 |
Fig. 2. Distance of disagreement between model outputs of 38 species and their measured abundances of TMC-1 CP (Gratier et al. 2016). |
3.2. Dynamical model
Figure 3 shows the results of the dynamical modeling for two selected clouds, L694 and L249-C, using the different values of the SC for CO (top panel) and CH3OH (bottom panel). The mean values of the calculated gas-phase abundances (with respect to H2) are plotted as a function of the logarithm of the cloud density (number density of H2;  in cm−3) (Taillard et al. 2023). They are represented with circles connected by lines, and the 1σ deviations are indicated by vertical bars. In these simulations, the density evolves with time as the cloud forms, and the presented abundances are taken at the final time of the simulation as a function of the local density. The computed abundances are compared to the observed abundances in L694 (gray stars) and L429-C (Taillard et al. 2023) (blue stars).
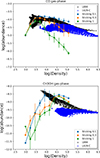 |
Fig. 3. Gas-phase abundances (with respect to H2) for CO (top) and CH3OH (bottom) as a function of the cloud density ( |

In the simulations, CO forms early during the evolution of the core. Due to the timescale of the density evolution within the dynamical simulations, CO efficiently condenses on dust grains at high densities, and, with a SC of 1, the gas-phase abundance of CO reaches a value below 10−6, orders of magnitude lower than the observations. Decreasing the sticking coefficient gradually increases the computed abundance of gas-phase CO in both clouds, and SC values of 0.1 and 0.3 provide a better agreement to the observation, especially for L694. For L429-C, the agreement at high density is also better with a SC of 0.3 than with a SC of 1.
For methanol (bottom panel), at high density the effect of the SC on the gas-phase abundance is smaller than for CO; the computed abundances of methanol are closer to the observations in L694 with a SC of 1. However, at lower densities (around 104 cm−3) a better agreement is obtained with a SC of 0.1. However, for methanol, whatever the SC used, none of the dynamical simulations can truly reproduce the observed gas-phaseabundances, especially at low densities, and notably in the case of L429-C.
In summary, with the static model, we find that lower sticking coefficients lead to less and later CO ice formation while the concentration of CO in the gas phase increases, to reach a plateau corresponding to the abundances observed in TMC-1. Therefore, lowering the SC strongly decreases the ice-to-gas ratio. In the hydrodynamic simulations, the increase in the gas-phase abundance of CO pulls the model closer to the observed abundances of L694, which cannot be properly modeled with a SC of 1. For L429-C, the agreement is also better at high density.
For CH3OH, the static model allows the abundances to reach the observational values in TMC-1 with the lower SCs of 0.1 and 0.3, and with a SC of 1. In the hydrodynamic simulations, the modeled abundances of CH3OH are, overall, not in good agreement with observations of L694 and L429-C, no matter the SC value used. These discrepancies could have many explanations that need to be studied further.
Of all of the parameters likely to influence the outcomes of the model, the SC can be tuned to fit certain molecules and contexts. For instance, this study considered the same SC across all species, while it may vary from one species to another. Furthermore, the SCs change according to the size of the dust grains (Laffon et al. 2021; Stadler et al. 2024) (the smaller the grain, the lower the SC) and adjusting the SC values along a grain size distribution could be an additional approach toward further improvement.
4. Conclusion
Using realistic sticking coefficients of gas-phase molecules on dust grains has a significant effect on the molecular abundances. In the static calculations, lower SC values lead to higher gas-phase maximum abundances of CO, matched by lower abundances on the grains. Therefore, lower sticking coefficients result in a strong decrease in the ice-to-gas ratio. The abundance curves for both the solid and the gas phase of CO are also shifted in time. For methanol, the SC has smaller impact on the computations as the effects on time and abundance are less marked. For CO and methanol, all gas-phase maximum abundances agree with the observations of TMC-1. The distance of disagreement calculated for a large set of 38 species also reveals a temporal shift in its best time. The computed abundances of methanol in the hydrodynamic model do not truly reproduce the observed values in the two selected dark clouds L694 and L429-C, whatever the SC used. However, hydrodynamic simulations of CO abundances benefit significantly from a lower sticking coefficient, especially for L694. While this study has not elucidated a specific sticking coefficient to use in gas-grain modeling, 0.3 seems to be a good starting point for further consideration.
References
- Acharyya, K., Fuchs, G. W., Fraser, H. J., van Dishoeck, E. F., & Linnartz, H. 2007, A&A, 466, 1005 [NASA ADS] [CrossRef] [EDP Sciences] [Google Scholar]
- Acharyya, K., Hassel, G. E., & Herbst, E. 2011, ApJ, 732, 73 [NASA ADS] [CrossRef] [Google Scholar]
- Agundez, M., & Wakelam, V. 2013, Chem. Rev., 113, 8710 [Google Scholar]
- Bisschop, S. E., Fraser, H. J., Öberg, K. I., van Dishoeck, E. F., & Schlemmer, S. 2006, A&A, 449, 1297 [NASA ADS] [CrossRef] [EDP Sciences] [Google Scholar]
- Bonnell, I. A., Dobbs, C. L., & Smith, R. J. 2013, MNRAS, 430, 1790 [NASA ADS] [CrossRef] [Google Scholar]
- Boogert, A. A., Gerakines, P. A., & Whittet, D. C. 2015, ARA&A, 53, 541 [NASA ADS] [CrossRef] [Google Scholar]
- Brown, D. E., George, S. M., Huang, C., et al. 1996, J. Phys. Chem., 100, 4988 [Google Scholar]
- Buch, V., & Czerminski, R. 1991, J. Chem. Phys., 95, 6026 [NASA ADS] [CrossRef] [Google Scholar]
- Buch, V., & Zhang, Q. 1991, ApJ, 379, 647 [Google Scholar]
- Buch, V., Delzeit, L., Blackledge, C., & Devlin, J. P. 1996, J. Phys. Chem., 100, 3732 [CrossRef] [Google Scholar]
- Chaabouni, H., Bergeron, H., Baouche, S., et al. 2012, A&A, 538, A128 [NASA ADS] [CrossRef] [EDP Sciences] [Google Scholar]
- Chu, L. E., Hodapp, K., & Boogert, A. 2020, ApJ, 904, 86 [NASA ADS] [CrossRef] [Google Scholar]
- Clément, A., Taillard, A., Wakelam, V., et al. 2023, A&A, 675, A165 [NASA ADS] [CrossRef] [EDP Sciences] [Google Scholar]
- Cuppen, H. M., Karssemeijer, L. J., & Lamberts, T. 2013, Chem. Rev., 113, 8840 [NASA ADS] [CrossRef] [Google Scholar]
- Cuppen, H. M., Walsh, C., Lamberts, T., et al. 2017, Space. Sci. Rev., 212, 1 [NASA ADS] [CrossRef] [Google Scholar]
- Dartois, E., Chabot, M., Bacmann, A., et al. 2020, A&A, 634, A103 [NASA ADS] [CrossRef] [EDP Sciences] [Google Scholar]
- Dusek, U., Frank, G. P., Hildebrandt, L., et al. 2006, Science, 312, 1375 [CrossRef] [PubMed] [Google Scholar]
- Elsila, J. E., Dworkin, J. P., Bernstein, M. P., Martin, M. P., & Sandford, S. A. 2007, ApJ, 660, 911 [NASA ADS] [CrossRef] [Google Scholar]
- Fuchs, G. W., Acharyya, K., Bisschop, S. E., et al. 2006, Faraday Discuss., 133, 331 [Google Scholar]
- Fuente, A., Navarro, D. G., Caselli, P., et al. 2019, A&A, 624, A115 [NASA ADS] [CrossRef] [EDP Sciences] [Google Scholar]
- Garrod, R. T., Wakelam, V., & Herbst, E. 2007, A&A, 467, 1103 [NASA ADS] [CrossRef] [EDP Sciences] [Google Scholar]
- Garrod, R. T., Weaver, S. L. W., Susanna, L., & Herbst, E. 2008, ApJ, 682, 283 [NASA ADS] [CrossRef] [Google Scholar]
- Gratier, P., Majumdar, L., Ohishi, M., et al. 2016, ApJS, 225, 25 [Google Scholar]
- Hasegawa, T. I., & Herbst, E. 1993, MNRAS, 261, 83 [NASA ADS] [CrossRef] [Google Scholar]
- He, J., Acharyya, K., & Vidali, G. 2016, ApJ, 823, 56 [Google Scholar]
- Hocuk, S., Szűcs, L., Caselli, P., et al. 2017, A&A, 604, A58 [NASA ADS] [CrossRef] [EDP Sciences] [Google Scholar]
- Hoose, C., & Möhler, O. 2012, Atmos. Chem. Phys., 12, 9817 [NASA ADS] [CrossRef] [Google Scholar]
- Jorgensen, J. K., Schöier, F. L., & van Dishoeck, E. F. 2005, A&A, 435, 177 [NASA ADS] [CrossRef] [EDP Sciences] [Google Scholar]
- Laffon, C., Ferry, D., Grauby, O., & Parent, P. 2021, Nat. Astron., 5, 445 [NASA ADS] [CrossRef] [Google Scholar]
- Matar, E., Bergeron, H., Dulieu, F., et al. 2010, J. Chem. Phys., 133, 104507 [Google Scholar]
- McClure, M. K., Rocha, W. R. M., Pontoppidan, K. M., et al. 2023, Nat. Astron., 7, 431 [NASA ADS] [CrossRef] [Google Scholar]
- Min, M., Waters, L. B. F. M., de Koter, A., et al. 2007, A&A, 462, 667 [NASA ADS] [CrossRef] [EDP Sciences] [Google Scholar]
- Noble, J. A., Congiu, E., Dulieu, F., & Fraser, H. J. 2012, MNRAS, 421, 768 [NASA ADS] [Google Scholar]
- Öberg, K. I., Garrod, R. T., van Dishoeck, E. F., & Linnartz, H. 2009, A&A, 504, 891 [NASA ADS] [CrossRef] [EDP Sciences] [Google Scholar]
- Powell, D., Gao, P., Murray-Clay, R., & Zhang, X. 2022, Nat. Astron., 6, 1147 [CrossRef] [Google Scholar]
- Qasim, D., Chuang, K.-J., Fedoseev, G., et al. 2018, A&A, 612, A83 [NASA ADS] [CrossRef] [EDP Sciences] [Google Scholar]
- Qasim, D., Fedoseev, G., Chuang, K.-J., et al. 2020, Nat. Astron., 4, 781 [NASA ADS] [CrossRef] [Google Scholar]
- Reboussin, L., Wakelam, V., Guilloteau, S., & Hersant, F. 2014, MNRAS, 440, 3557 [NASA ADS] [CrossRef] [Google Scholar]
- Ruaud, M., Wakelam, V., & Hersant, F. 2016, MNRAS, 459, 3756 [Google Scholar]
- Ruaud, M., Wakelam, V., Gratier, P., & Bonnell, I. A. 2018, A&A, 611, A96 [NASA ADS] [CrossRef] [EDP Sciences] [Google Scholar]
- Smith, I. W. M., Herbst, E., & Chang, Q. 2004, MNRAS, 350, 323 [Google Scholar]
- Stadler, C., Laffon, C., & Parent, P. 2024, A&A, 689, A50 [NASA ADS] [CrossRef] [EDP Sciences] [Google Scholar]
- Taillard, A., Wakelam, V., Gratier, P., et al. 2023, A&A, 670, A141 [NASA ADS] [CrossRef] [EDP Sciences] [Google Scholar]
- Wakelam, V., Herbst, E., & Selsis, F. 2006, A&A, 451, 551 [NASA ADS] [CrossRef] [EDP Sciences] [Google Scholar]
- Wakelam, V., Dartois, E., Chabot, M., et al. 2021, A&A, 652, A63 [NASA ADS] [CrossRef] [EDP Sciences] [Google Scholar]
- Wakelam, V., Gratier, P., Loison, J.-C., et al. 2024, A&A, 689, A63 [NASA ADS] [CrossRef] [EDP Sciences] [Google Scholar]
- Wirström, E. S., Geppert, W. D., Hjalmarson, A., et al. 2011, A&A, 533, A24 [NASA ADS] [CrossRef] [EDP Sciences] [Google Scholar]
All Tables
All Figures
|
Fig. 1. Gas-phase and solid-phase abundances of CO (top) and CH3OH (bottom) computed as a function of time using fixed physical conditions, with a SC of 1, 0.3, and 0.1, compared with the observational gas-phase abundance of TMC-1 CP (horizontal lines). |
| In the text | |
|
Fig. 2. Distance of disagreement between model outputs of 38 species and their measured abundances of TMC-1 CP (Gratier et al. 2016). |
| In the text | |
|
Fig. 3. Gas-phase abundances (with respect to H2) for CO (top) and CH3OH (bottom) as a function of the cloud density ( |
| In the text | |
Current usage metrics show cumulative count of Article Views (full-text article views including HTML views, PDF and ePub downloads, according to the available data) and Abstracts Views on Vision4Press platform.
Data correspond to usage on the plateform after 2015. The current usage metrics is available 48-96 hours after online publication and is updated daily on week days.
Initial download of the metrics may take a while.