Fig. 8
Download original image
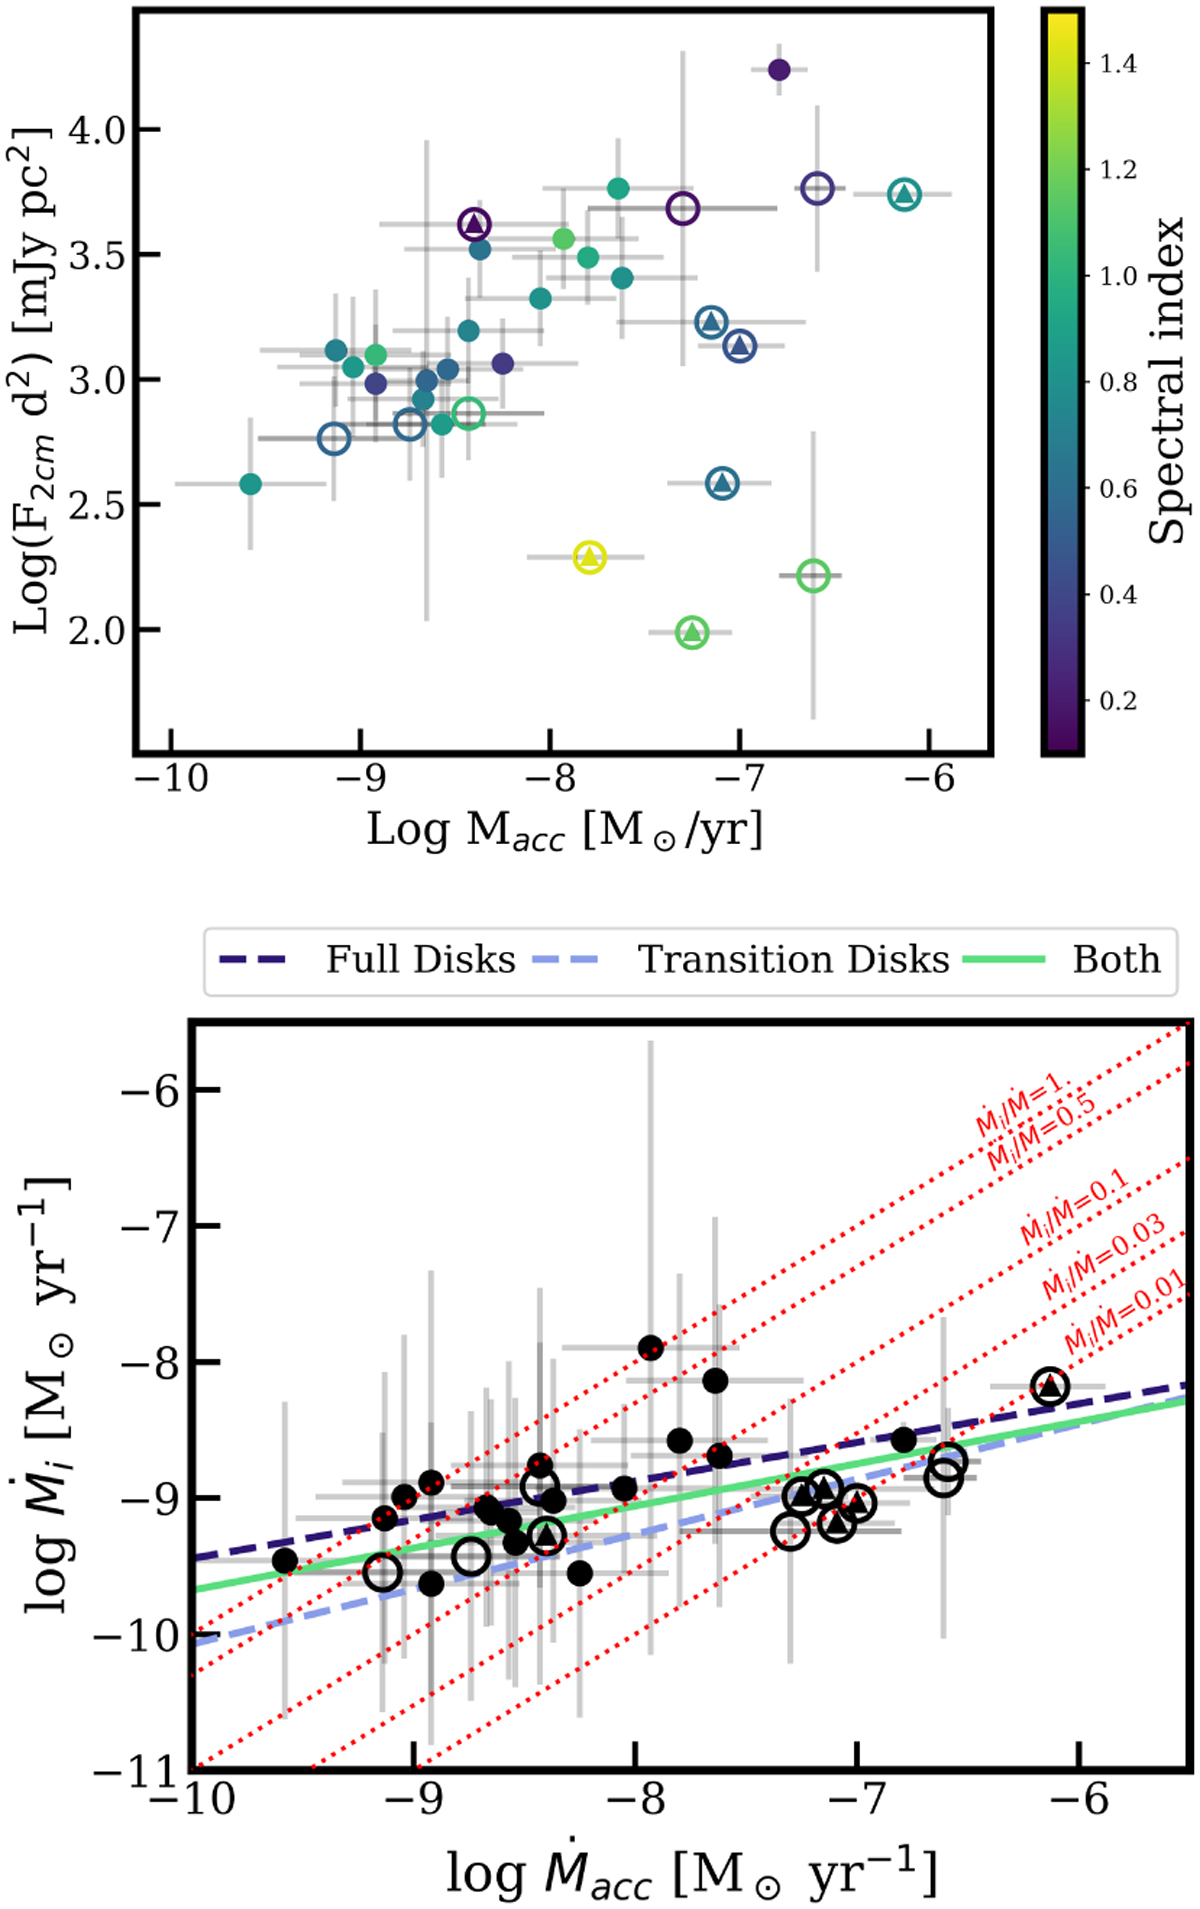
Free-free luminosity at 2 cm (top) and ionized mass-loss rate (bottom) as a function of the accretion rate for the full disks (·) and transition disks (∘). The luminosities at 2 cm of most of the transition disks are lower limits (triangles) to the real values, since the spectral indices used to extrapolate them are upper limits (see text for further details). The color bar shows the spectral index of the emission. In the bottom panel, HD 100453 is missing since it was not possible to calculate the ionized mass-loss rate (see Table A.2 and Rota et al. 2024).
Current usage metrics show cumulative count of Article Views (full-text article views including HTML views, PDF and ePub downloads, according to the available data) and Abstracts Views on Vision4Press platform.
Data correspond to usage on the plateform after 2015. The current usage metrics is available 48-96 hours after online publication and is updated daily on week days.
Initial download of the metrics may take a while.