| Issue |
A&A
Volume 700, August 2025
|
|
|---|---|---|
| Article Number | A32 | |
| Number of page(s) | 11 | |
| Section | Interstellar and circumstellar matter | |
| DOI | https://doi.org/10.1051/0004-6361/202554259 | |
| Published online | 31 July 2025 | |
A correlation between accretion and outflow rates for class II young stellar objects with full and transition disks
1
Leiden Observatory, Leiden University,
PO Box 9513,
2300
RA Leiden,
The Netherlands
2
INAF – Istituto di Radioastronomia,
Via Gobetti 101,
40129
Bologna,
Italy
3
Instituto de Radioastronomía y Astrofísica (IRyA-UNAM),
Morelia,
Michoacán
58089,
Mexico
4
European Southern Observatory,
Karl-Schwarzschild-Strasse 2,
85748
Garching,
Germany
5
Lunar and Planetary Laboratory, University of Arizona,
Tucson,
AZ
85721,
USA
6
Dipartimento di Fisica e Astronomia Augusto Righi, Universitá di Bologna,
Viale Berti Pichat 6/2,
Bologna,
Italy
7
Department of Physics and Astronomy, Rice University,
6100 Main Street, MS-108,
Houston,
TX
77005,
USA
8
Dipartimento di Fisica, Universitá degli Studi di Milano,
Via Celoria 16,
20133
Milano,
Italy
★ Corresponding author: This email address is being protected from spambots. You need JavaScript enabled to view it.
Received:
25
February
2025
Accepted:
21
May
2025
Abstract
Context. Magnetohydrodynamic (MHD) winds and jets are processes that influence the global evolution of the star and planet formation process. They originate in a wide range of regions of protoplanetary disks (∼ 1–30 au) and are thought to be the primary mechanisms driving accretion onto the central star. One indirect signature of these processes is the free-free emission from ionized gas close to the star.
Aims. We analyzed a sample of 31 class II young stellar objects (YSOs) with different types of disks: 18 full disks and 13 transition disks. All sources show evidence of excess free-free emission over the contribution of thermal dust. We investigated the origin of this emission and whether it is associated with other observables in disks with different types of substructures.
Methods. We first analyzed a sample of objects in Taurus, exploring possible correlations with the properties of the central star, the disk, and other disk-wind tracers. We then compared our findings with a sample of transition disks, for which free-free emission was already shown to be likely associated with an MHD wind and/or jet.
Results. We find no correlation between the detected free-free emission and either the X-ray or the [O I]6300 Å line properties. We find a strong correlation between the ionized mass-loss rate, as inferred from the free-free emission, and the accretion rate, suggesting that free-free emission in YSOs with full disks is associated with an MHD wind and/or jet.
Conclusions. The detected free-free emission in YSOs with both transition disks and full disks is likely associated with a similar mechanism, i.e., ionized gas close to the star from an MHD wind and/or jet. The free-free emission detected in transition disks shows hints of shallower correlations with accretion properties than in full disks. Whereas the efficiency in transforming accretion into outflow might differ in transition disks and full disks, considering the correlations between free-free emission and accretion properties, this difference could simply result from a bias toward strong accretors in the transition disk sample. Therefore, additional observations of a more complete and uniform sample are necessary to determine whether this change in correlation holds only for strong accretors or for transition disks in general.
Key words: accretion, accretion disks / protoplanetary disks / stars: variables: T Tauri, Herbig Ae/Be
© The Authors 2025
 Open Access article, published by EDP Sciences, under the terms of the Creative Commons Attribution License (https://creativecommons.org/licenses/by/4.0), which permits unrestricted use, distribution, and reproduction in any medium, provided the original work is properly cited.
This article is published in open access under the Subscribe to Open model. This email address is being protected from spambots. You need JavaScript enabled to view it. to support open access publication.
1 Introduction
A key question in the star and planet formation process is under-standing the accretion process in young stellar objects (YSOs) and the evolution of protoplanetary disks that are associated with them. Both simulations and observations have challenged the classical paradigm of viscous accretion, as the turbulence driven by magnetorotational instability (MRI) is insufficient to account for the observed accretion rates (Pascucci et al. 2023 and references therein). Instead, accretion is likely driven by radially extended magnetohydrodynamic (MHD) winds, i.e., outflowing gas from the disk atmosphere, while photoevaporative (PE) winds play a crucial role at later stages of disk evolution by clearing and dispersing the disks (e.g., Pascucci et al. 2023; Lesur 2021). It is thus crucial for our understanding of disk evolution to study the relationship between the accretion rate onto the star and the disk wind.
From an observational point of view, MHD disk winds exhibit a nested structure: high-velocity jets (∼ 100 km/s), which form through the recollimation of slow (∼ 30 km/s) inner winds, are surrounded by layers of atomic and molecular gas moving at decreasing velocities (such as those recently observed with JWST; e.g., Pascucci et al. 2025; Nisini et al. 2024). These processes originate across a wide range of disk regions (∼ 1–30 au) and may significantly impact the formation of planetesimals in the disks. It is particularly interesting to compare disk-wind processes in full disks and in transition disks with large inner dust cavities (>20 au, see, e.g. van der Marel 2023, for a review), as it raises the question of whether accreting material can be transported throughout the disk in a similar way as through an empty cavity (Martel & Lesur 2022). Photoevaporation is unlikely to play a role in clearing such transition disks, considering their massive outer disks, their high accretion rates, and large cavities (Owen & Clarke 2012; Picogna et al. 2019; Appelgren et al. 2023). Moreover, observed disk winds in those systems are more likely to be magnetically driven.
Traditionally, collimated jets and radially extended disk winds in class II sources are studied through high-resolution spectroscopy of optical forbidden lines, such as the [O I] 6300 Å line (e.g., Hartigan et al. 1995; Fang et al. 2018; Nisini et al. 2018). These lines are usually decomposed into a blueshifted high-velocity component (HVC) associated with a collimated fast jet, and a low-velocity component (LVC) often associated with an MHD wind (e.g., Simon et al. 2016; Banzatti et al. 2019). Based on their different line widths, the latter component can be further decomposed into a broad (BLVC) and a narrow component (NLVC). The study of the [O I]6300 Å line in a survey of young stars in Lupus, Chamaeleon, and σ Orionis shows that the luminosity of both the LVC and the HVC (L[O I] LVC and L[O I] HVC, respectively) correlates with the stellar accretion rate and the accretion luminosity, suggesting that accretion is the main driver of line luminosity. Both L[O I] LVC and L[O I] HVC show a very similar correlation with the accretion luminosity, suggesting a common mechanism for the formation of the LVC and HVC (Nisini et al. 2018). Moreover, a comprehensive study of 64 T Tauri stars shows that the BLVC and NLVC kinematics correlate, suggesting that both components originate from the same MHD disk wind (Banzatti et al. 2019). Finally, in line with the weaker emission expected over time, a survey conducted in the Upper Sco region by Fang et al. (2023) shows a lower detection rate of HVCs in the [O I] emission, while the proportion of single-component LVCs increases. These surveys show that a majority of transition disks do not exhibit any HVCs (∼ 70–80% disks without HVCs), while HVCs are not detected in only ∼ 40% of full disks (Fang et al. 2018; Banzatti et al. 2019). However, the sample on which these statistics are based is biased toward low-mass M-type stars, which tend to show a lower fraction of transition disks than higher-mass stars. Therefore, while the combination of optical and infrared observations hints at a possible difference in the ejection mechanisms in transition and full disks, additional observations are necessary to verify this hypothesis.
Another way to study MHD disk winds and jets is through the indirect signatures they are expected to produce, such as free-free emission from ionized gas close to the star. Emission at centimeter wavelengths is commonly associated with winds and jets at early (class 0/I) stages in the formation of the star (e.g., Anglada et al. 2018). A multiwavelength ALMA study of transition disks revealed free-free emission close to the star, strongly suggesting the presence of outflowing gas from an ionized jet and/or from a disk wind in these evolved YSOs (Rota et al. 2024). This study found a strong correlation between the ionized mass-loss rate, inferred from the free-free emission, and the stellar accretion rate, suggesting that accretion onto the star in these disks is mainly driven by an MHD wind and/or a jet. Recently, excess centimeter emission over the thermal dust contribution has also been found in a sample of class II YSOs with full disks in the Taurus star-forming region (Garufi et al. 2025). This centimeter excess appears to be associated with free-free emission and correlates with the accretion rate onto the central star, again suggesting a link between disk accretion and outflow. However, whether the same mechanism in transition and full disks drives accretion onto the central star is still a matter of debate (e.g., Manara et al. 2023).
In this paper, we investigate the origin of the free-free emission detected in the full disk sample analyzed by Garufi et al. (2025). Moreover, we compare the results found for full and transition disks, discussing whether accretion in these two classes of disks is driven by the same mechanism. In Section 2, we describe the sample of disks analyzed in this work. In Section 3, we analyze the origin and implications of the free-free emission detected in Garufi et al. (2025). Section 4 discusses our findings and compares the transition disks with full disks. Lastly, we draw our conclusions in Section 5.
2 Sample
This work analyzes a sample of 31 YSOs for which multiwavelength observations are available in the literature at millimeter and centimeter wavelengths. The main sample consists of 19 sources from Garufi et al. (2025), which are associated with 16 full disks (compact and substructured disks) and three transition disks with cavities larger than 20 au. From the sample reported in Garufi et al. (2025), we exclude DQ Tau and HP Tau, for which Garufi et al. (2025) report issues in their analysis. In addition, two sources with full disks (TW Hya and HD 163296) are included from Macías et al. (2021) and Guidi et al. (2022). In the comparison between full and transition disks in Section 4.2, we also consider the ten transition disks from Rota et al. (2024). This adds up to a sample of 18 full disks and 13 transition disks.
The spectral types of the stars included in the final sample vary from B9 to M3, the stellar masses range from 0.25 to 2.2 M⊙, the stellar luminosities range from ∼ 0.1 to ∼ 16 L⊙, and accretion rates onto the central star range from 10−10 to 10−6 M⊙/yr. Table A.1 reports the stellar and disk properties of all disks in the sample. All these disks show strong evidence of non-dust emission contaminating the total detected flux in their millimeter and/or centimeter photometry, analyzed in the studies listed above, with millimeter spectral indices α < 1.5. The detected non-dust emission ranges from 0.02 mJy to 2 mJy at 2 cm. The first two columns in Table A.2 report the fluxes and spectral indices estimated from the multiwavelength analysis reported by Rota et al. (2024), Garufi et al. (2025), Macías et al. (2021), and Guidi et al. (2022).
In addition to the sample of 31 objects analyzed in this work, we attempted the same multiwavelength analysis conducted by Garufi et al. (2025) on a sample of southern protoplanetary disks for which a 7 mm emission has been detected by ATCA (Ubach et al. 2012, 2017). However, although the SED suggests in some cases a contribution from non-dust emission, it was not possible to disentangle its contribution from the dust one, due to the lack of multiple observations at long-wavelengths needed to constrain the weak non-dust emission contribution. Additional observations at low frequencies of these disks are needed to conduct a similar analysis as the ones reported in this work.
3 Results
We begin with the analysis of the non-dust emission detected at radio wavelengths in a sample of protoplanetary disks in Taurus, reported in Garufi et al. (2025), in order to constrain its origin. This sample consists of 19 disks, eight of which show no evidence of substructures, have radii less than ∼ 50 au, and are thus classified as compact disks (e.g., Long et al. 2019). The remaining 11 disks show substructures in their dust distribution, and three out of these 11 disks are transition disks. Additionally, TW Hya and HD 163296 are added to the full disk sample with properties from the literature (Macías et al. 2021; Guidi et al. 2022).
Garufi et al. (2025) present a multiwavelength analysis of these disks, conducted including observations from VLA (Q, K, Ka, Ku, and C bands), ALMA (at 1.33 mm), IRAM Plateau de Bure Interferometer (at 2.7 mm), CSO (at 1.6 mm), and SCUBA (at 850 μ m). On average, their analysis constrains a non-dust emission contribution of 65% of the total flux at 2 cm, with the spectral indices αff spanning from 0.3 to 1.1, with a mean of 0.76 and median 0.80 (Figure 1). These flat spectral indices are not compatible with thermal dust emission and are commonly associated with thermal free-free emission from ionized gas close to the star (e.g., Anglada et al. 2018). We note that other nondust emission mechanisms, such as emission from high-velocity electrons interacting with the magnetic field, may contribute to a fraction of the detected flux (e.g., Dulk & Marsh 1982; Anglada et al. 2018). However, since this fraction cannot be determined and can vary from target to target, and since the analysis conducted by Garufi et al. (2025) strongly suggests that free-free emission is the dominant mechanism at cm wavelengths in these objects, hereafter we refer to this emission as free-free emission.
The free-free emission at 2 cm,  , scaled at 140 pc, strongly correlates with the stellar accretion rates determined from UV excess, with a Pearson coefficient of r = 0.66 (see Figure 2 in Garufi et al. 2025). No clear correlation between the estimated free-free luminosity at 2 cm and the stellar mass is observed (r = 0.24 ± 0.24, top panel in Figure 2), although we note that the range of stellar masses in our sample is relatively narrow. On the other hand, we found a correlation between the stellar accretion rate and the stellar mass (r = 0.77 ± 0.12), in agreement with the well-established relation reported by spectroscopic surveys (e.g., Alcalá et al. 2014; Hartmann et al. 2016). Lastly, we find a clear correlation between the free-free luminosity at 2 cm and the accretion luminosity, with r = 0.72 ± 0.17 (p-value: 5 × 10⁻⁴, bottom panel in Figure 2), and with the following relationship 1:
 (1)
(1)
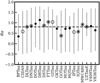 |
Fig. 1 Spectral index of the free-free emission estimated by Garufi et al. (2025) for compact disks (·), substructured disks (⊙), and transition disks (∘). The dashed line shows the median in the sample. |
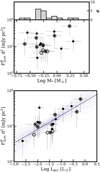 |
Fig. 2 Top: stellar mass as a function of the free-free luminosity at 2 cm estimated by Garufi et al. (2025) and histogram counts of the stellar mass. Bottom: accretion luminosity as a function of the free-free luminosity at 2 cm estimated by Garufi et al. (2025). In both panels, compact disks (·), substructured disks (⊙), and transition disks (∘) are shown. |
3.1 Photoevaporative wind or jet and/or MHD wind?
The detected free-free emission can be associated with gas from a disk wind (e.g., Pascucci et al. 2012), an ionized jet (e.g., Anglada et al. 2018), or both (e.g., Macías et al. 2016). In this section, we explore the possibility that the detected free-free emission is associated with a PE disk wind or a MHD wind and/or jet.
3.1.1 Accretion luminosity and X-ray luminosity
If the free-free emission is associated with ionization by stellar EUV and/or X-ray photons, the free-free luminosity is expected to be linearly correlated with the stellar EUV photon luminosity (ΦEUV, fully ionized wind case) and/or with the locally incident X-ray photon luminosity (LX, partially ionized case; Pascucci et al. 2012). In this analysis, we extrapolate the observed free-free emission from 2 to 3.5 cm using the derived spectral indices in order to compare with model estimates.
As shown by the top panel in Figure 3, no correlation between the X-ray luminosity and the free-free emission extrapolated to 3.5 cm and scaled to 140 pc is found (r = −0.3 ± 0.3). Moreover, the top panel in the figure indicates with a purple line the expected 3.5 cm free-free emission if the emission is associated with ionization by X-ray photons (see Equation (3) in Pascucci et al. 2012). In most cases, the detected free-free emission extrapolated to 3.5 cm is not compatible with the expectations from Pascucci et al. (2012). The absence of correlation and the observed excess over the expected 3.5 cm flux suggest that the observed free-free emission is unlikely to be associated with an X-ray driven PE wind.
Since the EUV photons are easily absorbed by the hydrogen atoms in the interstellar medium, direct measurements of the stellar EUV luminosity ΦEUV are difficult. Therefore, a direct comparison between the detected free-free emission and the ΦEUV is not possible. However, Pascucci et al. (2012) estimate the free-free flux at 3.5 cm from a fully ionized layer to range from 38.5 μJy to 38.5 mJy at 140 pc, for ΦEUV = 1041 photons/s or ΦEUV = 1044 photons/s, respectively. As shown from the colored region in the bottom panel in Figure 3, the observed fluxes at 3.5 cm appear, in general, consistent with free-free emission associated with a fully ionized disk wind. This is already suggested by the observed correlation between the accretion luminosity and the free-free luminosity (bottom panel in Figure 2), since the ΦEUV is in turn expected to correlate with the accretion luminosity (Ercolano & Owen 2016). However, PE disk winds are expected to be characterized by optically thin emission with a negative spectral index of −0.1 (Pascucci et al. 2012). On the other hand, flat or positive spectral indices (as the ones estimated for this sample) are expected to be associated with partially optically thick free-free emission due to other mechanisms, such as collimated ionized outflows and jets (Anglada et al. 2018).
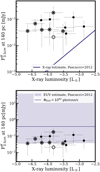 |
Fig. 3 X-ray luminosity as a function of the free-free luminosity at 3.5 cm for compact disks (·), substructured disks (⊙), and transition disks (∘). Top: the purple line shows the expected free-free luminosity associated with ionization by X-ray photons estimated following Equation (3) in Pascucci et al. (2012). Bottom: the colored region shows the expected free-free luminosity associated with ionization by EUV photons, as estimated by Pascucci et al. (2012), assuming a stellar EUV luminosity of ΦEUV = 1041–1044 photons/s. The case where ΦEUV = 1042 photons/s is shown with a purple line. |
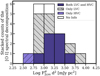 |
Fig. 4 Histogram showing the (stacked) distribution of [O I]6300 Å HVC and/or LVC detected in the sample. |
3.1.2 Optical forbidden lines
Optical forbidden lines, such as the [O I]6300 Å, have been used in different studies as diagnostics for MHD winds and jets (e.g., Nisini et al. 2024; Nisini et al. 2018). In this section, we explore possible correlations between the observed free-free emission and the line properties, both for the LVC and HVC, following the typical spectral decomposition in the [O I] line.
As reported in Nisini et al. (2024) and Simon et al. (2016), the forbidden line [O I]6300 Å is detected in 17 out of 19 targets. As shown in Figure 4, both HVCs and LVCs are detected in 8 out of 17 targets; LVC-only is detected in 8 out of 17 targets; HVC-only in one target. No information on the [O I] for CIDA 9 and HO Tau has been found in the literature. We explored possible correlations between the free-free luminosity and the [O I]6300 Å line properties, specifically the line peak velocity, the line FWHM, the total luminosity, and the mass-loss rate in the jet inferred from the HVC properties. No correlation is found, neither for the LVCs nor the HVCs. As an example, in Figure 5, we show the oxygen luminosity as a function of the free-free luminosity (Pearson coefficient |r| < 0.1 in all cases). Implications of the absence of these correlations are discussed in Section 4.
3.1.3 Ionized mass-loss rate of the jet emission
Assuming that free-free emission is associated with gas from an ionized jet and following the geometrical model of the free-free emission from a jet by Reynolds (1986), we estimated the ionized mass-loss rate  associated with the 2 cm free-free flux, using (see also Rota et al. (2024) and references therein):
![Mathematical equation: $\begin{align*} \left(\frac{\dot{M}_{\mathrm{i}}}{10^{-6} M_{\odot} \mathrm{yr}^{-1}}\right)= & 0.108\left[\frac{(2-\alpha)(0.1+\alpha)}{1.3-\alpha}\right]^{0.75} \\ & \times\left[\left(\frac{F_{v}}{\mathrm{mJy}}\right)\left(\frac{v}{10 \mathrm{GHz}}\right)^{-\alpha}\right]^{0.75}\left(\frac{v_{\mathrm{jet}}}{200 \mathrm{~km} \mathrm{~s}^{-1}}\right)\\ & \times\left(\frac{v_{\mathrm{m}}}{10 \mathrm{GHz}}\right)^{0.75 \alpha-0.45}\left(\frac{\theta_{0}}{\mathrm{rad}}\right)^{0.75}(\sin i)^{-0.25} \\ & \times\left(\frac{d}{\mathrm{kpc}}\right)^{1.5}\left(\frac{T}{10^{4} \mathrm{~K}}\right)^{-0.075}, \end{align*}$](/articles/aa/full_html/2025/08/aa54259-25/aa54259-25-eq4.png) (2)
(2)
where α is the spectral index, Fv is the continuum flux at the frequency ν (2 cm in our case), and d is the distance to the source. The injection opening angle of the jet θ0 is approximated as 2 arctan (θmin/θmaj) with the ratio between the minor and major axis of the jet θmin/θmaj assumed equal to 0.5 (see Kavak et al. 2021). A temperature of T = 104 K is adopted for the ionized gas and the jet is assumed to be fully ionized. Since the value of the turnover frequency has not been determined directly from observations yet (Anglada et al. 2018) and there is not a significant dependence of the ionized mass-loss rate on this value, we assumed a turnover frequency of v = 40 GHz. This assumption is supported by the analysis of Garufi et al. (2025), who find no curvature in the free-free emission spectrum below 40 GHz. We assumed that the jet is perpendicular to the plane of the disk, and thus the inclination of the disk is taken as the inclination of the jet i (see Table A.1). Lastly, we assumed that the velocity of the jet vjet is
 (3)
(3)
(see the discussion in Anglada et al. 2018).
Figure 6 shows the ionized mass-loss rate, as inferred from the 2 cm free-free emission, as a function of the accretion rate onto the central star, estimated for all the disks in the sample. Table A.2 reports the estimated  values. A strong correlation between the accretion rate and the ionized mass rate is found (r = 0.70 ± 0.18), with no particular sign of segregation between the compact and structured disks and with a median of
  . As we discuss in the following section, this positive correlation suggests that jets and/or ionized MHD winds are one of the main drivers of accretion onto the star in evolved YSOs.
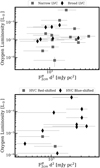 |
Fig. 5 [O I]6300 Å luminosity for the HVC (bottom) and LVC (top) as a function of the free-free luminosity. The Pearson coefficient in both plots is |r| < 0.1. |
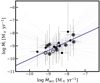 |
Fig. 6 Ionized mass-loss rate inferred from the free-free emission flux at 2 cm as a function of accretion rate onto the central star. Compact disks (·), substructured disks (⊙), and transition disks (∘) are shown. |
4 Discussion
4.1 Origin of free-free emission in YSOs with full disks
We explored various correlations between the observed free-free emission and other observables, to determine the origin of the free-free emission in the disk sample of Garufi et al. (2025). Considering the lack of correlation between the free-free emission and the X-ray (Figure 3) and the strong correlation between the ionized mass-loss rate (inferred from the free-free emission) and the accretion rate (Figure 6), the free-free emission most likely originates from ionized gas associated with a jet or MHD-disk wind similar to the results found for transition disks by Rota et al. (2024). The free-free emission could not be spatially resolved in full disks, as was the case for transition disks, and, thus, it could not be constrained to the innermost disk regions. However, the large number of data points from the photometry up to 2 cm still allowed for a full disentangling of the free-free emission from the thermal dust emission at shorter wavelengths (Garufi et al. 2025). The flat positive spectral indices suggest partially optically thick free-free emission, which is commonly found in collimated winds (Anglada et al. 2018). Also, no significant differences between the compact and the substructured disks (defined full disks in this work) have been found in the correlation with the accretion rate. This implies that MHD disk winds may play an important role in disk evolution, regardless of the dust substructures. The absence of correlations between any oxygen line properties and the free-free emission (Figure 5) suggests that the detected free-free emission traces a different part of the jet or MHD wind than the more neutral oxygen line. Another possibility is that other contributions contaminate the detected free-free emission. Nonthermal emissions, such as gyro-synchrotron emission, which cannot be subtracted using the SED fitting method applied by Garufi et al. (2025), may contribute to an indeterminable fraction of the flux. This could make it impossible to observe a correlation between the [O I] properties and the “pure” free-free emission. However, this latter possibility is unlikely, since these other types of emission are expected to vary from target to target, which would also affect the correlation between the free-free flux and the accretion rate.
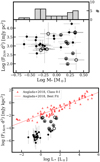 |
Fig. 7 Top: stellar mass as a function of the free-free luminosity at 2 cm estimated by Garufi et al. (2025) and by Rota et al. (2024). The plot also reports the histogram counts of the stellar mass. Bottom: 3.6 cm luminosity as a function of the stellar or bolometric luminosity for the two analyzed samples and for class 0-I radio jets (Anglada et al. 2018). In both panels, full disks (·) and transition disks (∘) are shown. The luminosities of most of the transition disks are lower limits (triangles) to the real values, since the spectral indices used to extrapolate them are upper limits (see text for further details). |
4.2 Comparison between transition disks and full disks
To assess whether the mechanisms behind the free-free emission are universal in all classes of protoplanetary disks, we compare the samples from Garufi et al. (2025) (to which we added TW Hya and HD 163296 from the literature, Macías et al. 2021; Guidi et al. 2022) and Rota et al. (2024). In this comparison, CIDA 9, GI Tau, and IP Tau, analyzed in Garufi et al. (2025), are classified as transition disks. The question is whether the mechanisms involved are different for transition disks than for full disks, considering the presence of the large inner cavity and the possible origin of the cavity (Martel & Lesur 2022; van der Marel 2023).
In Figure 7, we show the free-free emission as a function of stellar properties for both samples. For the transition disks analyzed in Rota et al. (2024), a complete study of the dust contribution at low frequency was possible only in three disks (GG Tau, HD 100546, and HD 142527). In all the other cases, the estimated spectral indices of the free-free emission are upper limits to the real values (Table A.2 and Rota et al. (2024) for further details). The extrapolated free-free luminosities at 2 cm and 3.6 cm for these disks are thus lower limits. As shown in the top panel, the sample of transition disks is biased toward highly massive and highly accreting targets, with accretion rates spanning from 10−7.5 to 10−6 M⊙/yr. All disks in the two samples are associated with class II sources and are found to be under-luminous when compared to younger radio jets detected in class 0-I YSOs (Anglada et al. 2018, bottom panel in Figure 7). This is expected since disks around class II sources are more evolved than those associated with class 0-I YSOs. Their total luminosity is more affected by the stellar contribution than that of younger sources, whose accretion component of the luminosity is correlated with the flux of the radio jet (Anglada et al. 2018). Therefore, the luminosity of class II radio jets is expected to correlate with only a fraction of the bolometric luminosity (Palau et al. 2024; Betti et al. 2023; Riaz & Bally 2021). Moreover, as shown by the figure, since the sample of transition disks is biased toward higher accretors, it is expected to be biased toward more massive disks and thus more luminous compared to less massive disks around class II YSOs.
The top panel in Figure 8 shows the free-free luminosity at 2 cm as a function of the stellar accretion rate for both transition and full disks. Since the extrapolated free-free luminosities at 2 cm for most of the transition disks are lower limits, a quantitative comparison between the transition and full disks is challenging. However, considering the lower limits, the two samples hint at a similar trend of the 2 cm free-free luminosity with the stellar accretion rate. Additional observations of transition disks at low frequencies are required to disentangle the dust emission close to the star from the free-free emission, allowing one to investigate possible differences between the transition and full disk samples (see Section 4.3 for more details).
Assuming that the free-free emission is associated with gas from an ionized jet and using Equation (2), we compare the ionized mass-loss rate  associated with the 2 cm free-free flux in the two samples. As shown by the bottom panel of Figure 8 and as reported in Table A.2,
  spans from 10−10 to 10−8 M⊙/yr and shows a similar trend with the accretion rate in both samples. A strong correlation between the accretion rate and the ionized mass rate is found both for the transition disks (dashed blue line, see also Rota et al. 2024) and the full disks (dashed purple line, see also Figure 6). Moreover, a hint of correlation is found when combining the two samples (solid green line). The found relationships are summarized in the following 2:
transition disks only (r = 0.79 ± 0.19, p = 0.002),
 (a)
(a)full disks only (r = 0.64 ± 0.19, p = 0.004),
 (b)
(b)both samples combined (r = 0.53 ± 0.16, p = 0.002),
 (c)
(c)
The correlation reported for the transition disk sample (Equation (a)) is affected by the fact that the ionized mass-loss rate in most of these targets is inferred from lower limits on the 2 cm free-free flux and its exact shape should be analyzed together with a complete study of the dust emission in the cavity of these disks. However, excluding these targets from the combined sample of full and transition disks leads to a consistent correlation with the one reported in Equation (c). Both the transition disks, the full disks, and the combined sample show fully consistent slopes within the error bars.
These correlations suggest that the detected free-free emission in both samples is associated with a similar mechanism, i.e., ionized gas close to the star from an MHD wind and/or jet, and reveals a strong relation between the accretion and outflow properties. One possibility is that, in both transition and full disks, jets and/or MHD winds are one of the main drivers of accretion onto the central star. On the other hand, other processes, such as turbulence (e.g., Manara et al. 2023), might be the main drivers of the accretion, which causes a shock that consequently launches the outflow.
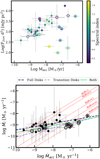 |
Fig. 8 Free-free luminosity at 2 cm (top) and ionized mass-loss rate (bottom) as a function of the accretion rate for the full disks (·) and transition disks (∘). The luminosities at 2 cm of most of the transition disks are lower limits (triangles) to the real values, since the spectral indices used to extrapolate them are upper limits (see text for further details). The color bar shows the spectral index of the emission. In the bottom panel, HD 100453 is missing since it was not possible to calculate the ionized mass-loss rate (see Table A.2 and Rota et al. 2024). |
4.3 Implications for angular momentum transport in disks
The ratio between the ionized mass-loss rate and the accretion rate  can be used to characterize the efficiency ξ of the outflow launch. If all the MHD disk wind is ejected from a small region at the footpoint radius, then
  , where λ is the magnetic lever arm (e.g., Pelletier & Pudritz 1992; Pascucci et al. 2023). A more heavily mass-loaded MHD-disk wind (large ξ) will necessarily have a smaller λ, i.e., a smaller angular momentum per unit mass, and vice versa (Pascucci et al. 2023). Inside the MRI-active region (0.05-0.5 au), λ ∼ 5 is expected from global simulations (Jacquemin-Ide et al. 2021). As shown by the top panel in Figure 9,
  spans from 0.01 to 1.3 in the combined sample of transition and full disks (median 0.18), with the transition disks showing a median
  of 0.014 and the full disks a median of 0.29. Assuming a jet origin, this range of values is consistent with 1/λ = 0.2 expected from global simulations of jet-launching in the MRI-active region (Jacquemin-Ide et al. 2021). Stronger accretors show a tendency toward lower jet efficiencies, with values of
  , while sources with low accretion rates (i.e.,
  show a ratio larger than 0.1. These results are consistent with findings from the HVC of the [O I]6300 A line in a sample of 131 disks in Lupus, Chamaeleon, and σ Orionis star-forming regions (Nisini et al. 2018).
Moreover, the  ratios in the transition and full disk samples are unlikely drawn by the same distribution, as confirmed by the Kolmogorov-Smirnov (K-S) two-sided test for the null hypothesis that the two samples are drawn from the same continuous distribution (p-value of ∼ 0.0015). However, this result is probably due to the bias toward highly accreting disks, which affects the transition disk sample and is probably affected by the fact that most of the extrapolated free-free fluxes at 2 cm for transition disks are lower limits (see Table A.2). The tendency of weaker accretors toward larger values of
  suggests that the jet efficiency in stronger accretors show a shallower correlation with the accretion rate. Another possibility is that transition disks in general show a different efficiency in transforming accretion into outflow than full disks, probably in turn related to the efficiency of transport of material through the cavity. New observations of transition disks covering the lower end of the accretion rate distribution and of full disks in higher accreting targets are needed to assess how the jet efficiency in the two samples differs.
Lastly, the  ratio depends on the stellar mass, as shown by the bottom panel in Figure 9. An anticorrelation between these two quantities is found for the combined sample of full and transition disks, with a Pearson coefficient r = −0.65 ± 0.14. The correlation holds for the sample of transition disks alone (r = −0.84 ± 0.17), while it disappears when considering the sample of full disks alone (r = −0.24 ± 0.24). This strong anticorrelation, driven by the sources with high accretion rates, might suggest that the found correlation between the ionized mass-loss rate and the accretion rate might be driven by the stellar mass. As shown by Equations (2) and (3),
  depends on the stellar mass through the jet velocity vjet. To test if the correlation between
  and
and  is driven by the stellar mass, we fixed the jet velocity in Equation (2) to 200 km/s and recalculated the ionized mass-loss rate. Even with this assumption, the correlation between the ionized mass-loss rate and the accretion rate holds both for full and transition disks, showing that it is unlikely driven by the stellar mass dependency. Therefore, the anticorrelation between the jet efficiency and the stellar mass is likely driven by the steep correlation between the stellar accretion rate and the stellar mass (see Section 3).
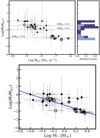 |
Fig. 9 Top: jet efficiency at 2 cm as a function of the accretion rate. The plot also reports the histogram counts of the |

5 Conclusions
In this work, we analyzed a sample of 31 YSOs for which multiwavelength observations at millimeter and centimeter wavelengths are available in the literature. We first analyzed the free-free emission recently detected in a sample of class II YSOs with disks in Taurus, reported by Garufi et al. (2025). No correlation is found between the detected free-free emission and either the X-ray or the [O I] 6300 A line properties. On the other hand, we find a strong correlation between the detected free-free luminosity and the accretion luminosity and between the ionized mass-loss rate (as inferred from the free-free emission) and the stellar accretion rate. We thus conclude that the free-free emission in those YSOs most likely originates from ionized gas associated with a jet or MHD-disk wind and traces a different part of the jet and/or MHD wind than the more neutral oxygen line.
We compared our findings on the full disk sample with the transition disk sample from Rota et al. (2024). Our results can be summarized as follows:
Considering the lower limits, the free-free luminosity detected in transition disks suggests a similar trend with the accretion rate as observed in full disks;
A similar correlation between the ionized mass-loss rate (inferred from the free-free emission) and the accretion rate is found for both samples;
Sources with high accretion rates (>10−8 M⊙/yr) show a tendency toward lower jet efficiency, with
 , while weaker accretors show ratios larger than 0.1;
A strong correlation driven by the high accretors is found between
 and stellar mass.
The detected free-free emission in both samples is likely associated with a similar mechanism, i.e., ionized gas close to the star from an MHD wind and/or jet. The lower median values of  found for the transition disk sample hint at a different rate of efficiency in transforming accretion into outflow than full disks, probably related to the transport of material through the cavity. However, since a complete study of the dust contribution at low frequencies was not possible for all the transition disks, additional long-wavelength observations are required to quantitatively investigate the free-free emission contribution in these targets. Moreover, since the sample of transition disks is biased toward high accretors, new observations of highly accreting full disks and less accreting transition disks are needed to assess whether the hinted shallower correlation between the jet efficiency and the accretion rate holds in general for transition disks or whether it applies to strong accretors only. This will help in understanding how efficiently the material is transported through the large cavities observed in transition disks.
Acknowledgements
The authors thank the referee for their useful comments that have contributed to improving the manuscript. CC-G acknowledges support from UNAM DGAPA PAPIIT grant IG101224 and from CONAHCyT Ciencia de Frontera project ID 86372. SF is funded by the European Union (ERC, UNVEIL, 101076613), and acknowledges financial contribution from PRINMUR 2022YP5ACE. Views and opinions expressed, however, are those of the author(s) only and do not necessarily reflect those of the European Union or the ERC. Neither the European Union nor the granting authority can be held responsible for them.
Appendix A Tables
The sample of this work.
Summary of the free-free fluxes at 2 cm, the spectral indices of the free-free emission, and the ionized mass-loss rate of the outflow as inferred from the free-free emission.
References
- Alcalá, J. M., Natta, A., Manara, C. F., et al. 2014, A&A, 561, A2 [NASA ADS] [CrossRef] [EDP Sciences] [Google Scholar]
- Anglada, G., Rodríguez, L. F., & Carrasco-González, C., 2018, A&A Rev., 26, 3 [Google Scholar]
- Appelgren, J., Lambrechts, M., & van der Marel, N., 2023, A&A, 673, A139 [NASA ADS] [CrossRef] [EDP Sciences] [Google Scholar]
- Banzatti, A., Pascucci, I., Edwards, S., et al. 2019, ApJ, 870, 76 [Google Scholar]
- Betti, S. K., Follette, K. B., Ward-Duong, K., et al. 2023, AJ, 166, 262 [Google Scholar]
- Dionatos, O., Woitke, P., Güdel, M., et al. 2019, A&A, 625, A66 [NASA ADS] [CrossRef] [EDP Sciences] [Google Scholar]
- Dulk, G. A., & Marsh, K. A., 1982, ApJ, 259, 350 [NASA ADS] [CrossRef] [Google Scholar]
- Ercolano, B., & Owen, J. E., 2016, MNRAS, 460, 3472 [Google Scholar]
- Fang, M., Pascucci, I., Edwards, S., et al. 2018, ApJ, 868, 28 [NASA ADS] [CrossRef] [Google Scholar]
- Fang, M., Pascucci, I., Edwards, S., et al. 2023, ApJ, 945, 112 [NASA ADS] [CrossRef] [Google Scholar]
- Francis, L., & van der Marel, N., 2020, ApJ, 892, 111 [Google Scholar]
- Gaia Collaboration (Brown, A. G. A., et al.,) 2018, A&A, 616, A1 [NASA ADS] [CrossRef] [EDP Sciences] [Google Scholar]
- Gangi, M., Antoniucci, S., Biazzo, K., et al. 2022, A&A, 667, A124 [NASA ADS] [CrossRef] [EDP Sciences] [Google Scholar]
- Garufi, A., Carrasco-Gonzalez, C., Macias, E., et al. 2025, A&A, 694, A290 [NASA ADS] [CrossRef] [EDP Sciences] [Google Scholar]
- Güdel, M., Briggs, K. R., Arzner, K., et al. 2007, A&A, 468, 353 [Google Scholar]
- Guidi, G., Isella, A., Testi, L., et al. 2022, A&A, 664, A137 [NASA ADS] [CrossRef] [EDP Sciences] [Google Scholar]
- Harsono, D., Long, F., Pinilla, P., et al. 2024, ApJ, 961, 28 [NASA ADS] [CrossRef] [Google Scholar]
- Hartigan, P., Edwards, S., & Ghandour, L., 1995, ApJ, 452, 736 [Google Scholar]
- Hartmann, L., Herczeg, G., & Calvet, N., 2016, ARA&A, 54, 135 [Google Scholar]
- Herczeg, G. J., Chen, Y., Donati, J.-F., et al. 2023, ApJ, 956, 102 [NASA ADS] [CrossRef] [Google Scholar]
- Jacquemin-Ide, J., Lesur, G., & Ferreira, J., 2021, A&A, 647, A192 [EDP Sciences] [Google Scholar]
- Kavak, Ü., Sánchez-Monge, Á., López-Sepulcre, A.,, et al. 2021, A&A, 645, A29 [NASA ADS] [CrossRef] [EDP Sciences] [Google Scholar]
- Kelly, B. C., 2007, ApJ, 665, 1489 [Google Scholar]
- Lesur, G. R. J., 2021, A&A, 650, A35 [NASA ADS] [CrossRef] [EDP Sciences] [Google Scholar]
- Long, F., Herczeg, G. J., Harsono, D., et al. 2019, ApJ, 882, 49 [Google Scholar]
- Macías, E., Anglada, G., Osorio, M., et al. 2016, ApJ, 829, 1 [Google Scholar]
- Macías, E., Guerra-Alvarado, O., Carrasco-González, C., et al. 2021, A&A, 648, A33 [EDP Sciences] [Google Scholar]
- Manara, C. F., Ansdell, M., Rosotti, G. P., et al. 2023, in Protostars and Planets VII, eds. S. Inutsuka, Y. Aikawa, T. Muto, K. Tomida, & M. Tamura, Astronomical Society of the Pacific Conference Series, 534, 539 [NASA ADS] [Google Scholar]
- Martel, E., & Lesur, G., 2022, in SF2A-2022: Proceedings of the Annual meeting of the French Society of Astronomy and Astrophysics, eds. J. Richard, A. Siebert, E. Lagadec, et al. 321 [Google Scholar]
- Nisini, B., Antoniucci, S., Alcalá, J. M., et al. 2018, A&A, 609, A87 [EDP Sciences] [Google Scholar]
- Nisini, B., Gangi, M., Giannini, T., et al. 2024, A&A, 683, A116 [NASA ADS] [CrossRef] [EDP Sciences] [Google Scholar]
- Owen, J. E., & Clarke, C. J., 2012, MNRAS, 426, L96 [NASA ADS] [CrossRef] [Google Scholar]
- Palau, A., Huélamo, N., Barrado, D., Dunham, M. M., & Lee, C. W., 2024, New A Rev., 99, 101711 [Google Scholar]
- Pascucci, I., Gorti, U., & Hollenbach, D., 2012, ApJ, 751, L42 [Google Scholar]
- Pascucci, I., Banzatti, A., Gorti, U., et al. 2020, ApJ, 903, 78 [Google Scholar]
- Pascucci, I., Cabrit, S., Edwards, S., et al. 2023, in Astronomical Society of the Pacific Conference Series, 534, eds. S. Inutsuka, Y. Aikawa, T. Muto, K. Tomida, & M. Tamura, 567 [Google Scholar]
- Pascucci, I., Beck, T. L., Cabrit, S., et al. 2025, Nat. Astron., 9, 81 [Google Scholar]
- Pelletier, G., & Pudritz, R. E., 1992, ApJ, 394, 117 [NASA ADS] [CrossRef] [Google Scholar]
- Picogna, G., Ercolano, B., Owen, J. E., & Weber, M. L., 2019, MNRAS, 487, 691 [Google Scholar]
- Reynolds, S. P., 1986, ApJ, 304, 713 [NASA ADS] [CrossRef] [Google Scholar]
- Riaz, B., & Bally, J., 2021, MNRAS, 501, 3781 [NASA ADS] [Google Scholar]
- Ricci, L., Testi, L., Natta, A., et al. 2010, A&A, 512, A15 [CrossRef] [EDP Sciences] [Google Scholar]
- Rota, A. A., Meijerhof, J. D., van der Marel, N., et al. 2024, A&A, 684, A134 [NASA ADS] [CrossRef] [EDP Sciences] [Google Scholar]
- Ryspaeva, E., Kholtygin, A., & Lyutikov, M., 2023, MNRAS, 521, 2427 [NASA ADS] [CrossRef] [Google Scholar]
- Simon, M. N., Pascucci, I., Edwards, S., et al. 2016, ApJ, 831, 169 [Google Scholar]
- Ubach, C., Maddison, S. T., Wright, C. M., et al. 2012, MNRAS, 425, 3137 [NASA ADS] [CrossRef] [Google Scholar]
- Ubach, C., Maddison, S. T., Wright, C. M., et al. 2017, MNRAS, 466, 4083 [NASA ADS] [Google Scholar]
- van der Marel, N., 2023, Eur. Phys. J. Plus, 138, 225 [Google Scholar]
- Varga, J., Hogerheijde, M., van Boekel, R., et al. 2021, A&A, 647, A56 [NASA ADS] [CrossRef] [EDP Sciences] [Google Scholar]
- Vioque, M., Oudmaijer, R. D., Baines, D., Mendigutía, I., & Pérez-Martínez, R., 2018, A&A, 620, A128 [NASA ADS] [CrossRef] [EDP Sciences] [Google Scholar]
- Wichittanakom, C., Oudmaijer, R. D., Fairlamb, J. R., et al. 2020, MNRAS, 493, 234 [Google Scholar]
The linear regression was performed with linmix (Kelly 2007).
The linear regression was performed with linmix (Kelly 2007).
All Tables
Summary of the free-free fluxes at 2 cm, the spectral indices of the free-free emission, and the ionized mass-loss rate of the outflow as inferred from the free-free emission.
All Figures
|
Fig. 1 Spectral index of the free-free emission estimated by Garufi et al. (2025) for compact disks (·), substructured disks (⊙), and transition disks (∘). The dashed line shows the median in the sample. |
| In the text | |
|
Fig. 2 Top: stellar mass as a function of the free-free luminosity at 2 cm estimated by Garufi et al. (2025) and histogram counts of the stellar mass. Bottom: accretion luminosity as a function of the free-free luminosity at 2 cm estimated by Garufi et al. (2025). In both panels, compact disks (·), substructured disks (⊙), and transition disks (∘) are shown. |
| In the text | |
|
Fig. 3 X-ray luminosity as a function of the free-free luminosity at 3.5 cm for compact disks (·), substructured disks (⊙), and transition disks (∘). Top: the purple line shows the expected free-free luminosity associated with ionization by X-ray photons estimated following Equation (3) in Pascucci et al. (2012). Bottom: the colored region shows the expected free-free luminosity associated with ionization by EUV photons, as estimated by Pascucci et al. (2012), assuming a stellar EUV luminosity of ΦEUV = 1041–1044 photons/s. The case where ΦEUV = 1042 photons/s is shown with a purple line. |
| In the text | |
|
Fig. 4 Histogram showing the (stacked) distribution of [O I]6300 Å HVC and/or LVC detected in the sample. |
| In the text | |
|
Fig. 5 [O I]6300 Å luminosity for the HVC (bottom) and LVC (top) as a function of the free-free luminosity. The Pearson coefficient in both plots is |r| < 0.1. |
| In the text | |
|
Fig. 6 Ionized mass-loss rate inferred from the free-free emission flux at 2 cm as a function of accretion rate onto the central star. Compact disks (·), substructured disks (⊙), and transition disks (∘) are shown. |
| In the text | |
|
Fig. 7 Top: stellar mass as a function of the free-free luminosity at 2 cm estimated by Garufi et al. (2025) and by Rota et al. (2024). The plot also reports the histogram counts of the stellar mass. Bottom: 3.6 cm luminosity as a function of the stellar or bolometric luminosity for the two analyzed samples and for class 0-I radio jets (Anglada et al. 2018). In both panels, full disks (·) and transition disks (∘) are shown. The luminosities of most of the transition disks are lower limits (triangles) to the real values, since the spectral indices used to extrapolate them are upper limits (see text for further details). |
| In the text | |
|
Fig. 8 Free-free luminosity at 2 cm (top) and ionized mass-loss rate (bottom) as a function of the accretion rate for the full disks (·) and transition disks (∘). The luminosities at 2 cm of most of the transition disks are lower limits (triangles) to the real values, since the spectral indices used to extrapolate them are upper limits (see text for further details). The color bar shows the spectral index of the emission. In the bottom panel, HD 100453 is missing since it was not possible to calculate the ionized mass-loss rate (see Table A.2 and Rota et al. 2024). |
| In the text | |
|
Fig. 9 Top: jet efficiency at 2 cm as a function of the accretion rate. The plot also reports the histogram counts of the |
| In the text | |
Current usage metrics show cumulative count of Article Views (full-text article views including HTML views, PDF and ePub downloads, according to the available data) and Abstracts Views on Vision4Press platform.
Data correspond to usage on the plateform after 2015. The current usage metrics is available 48-96 hours after online publication and is updated daily on week days.
Initial download of the metrics may take a while.