Fig. 11
Download original image
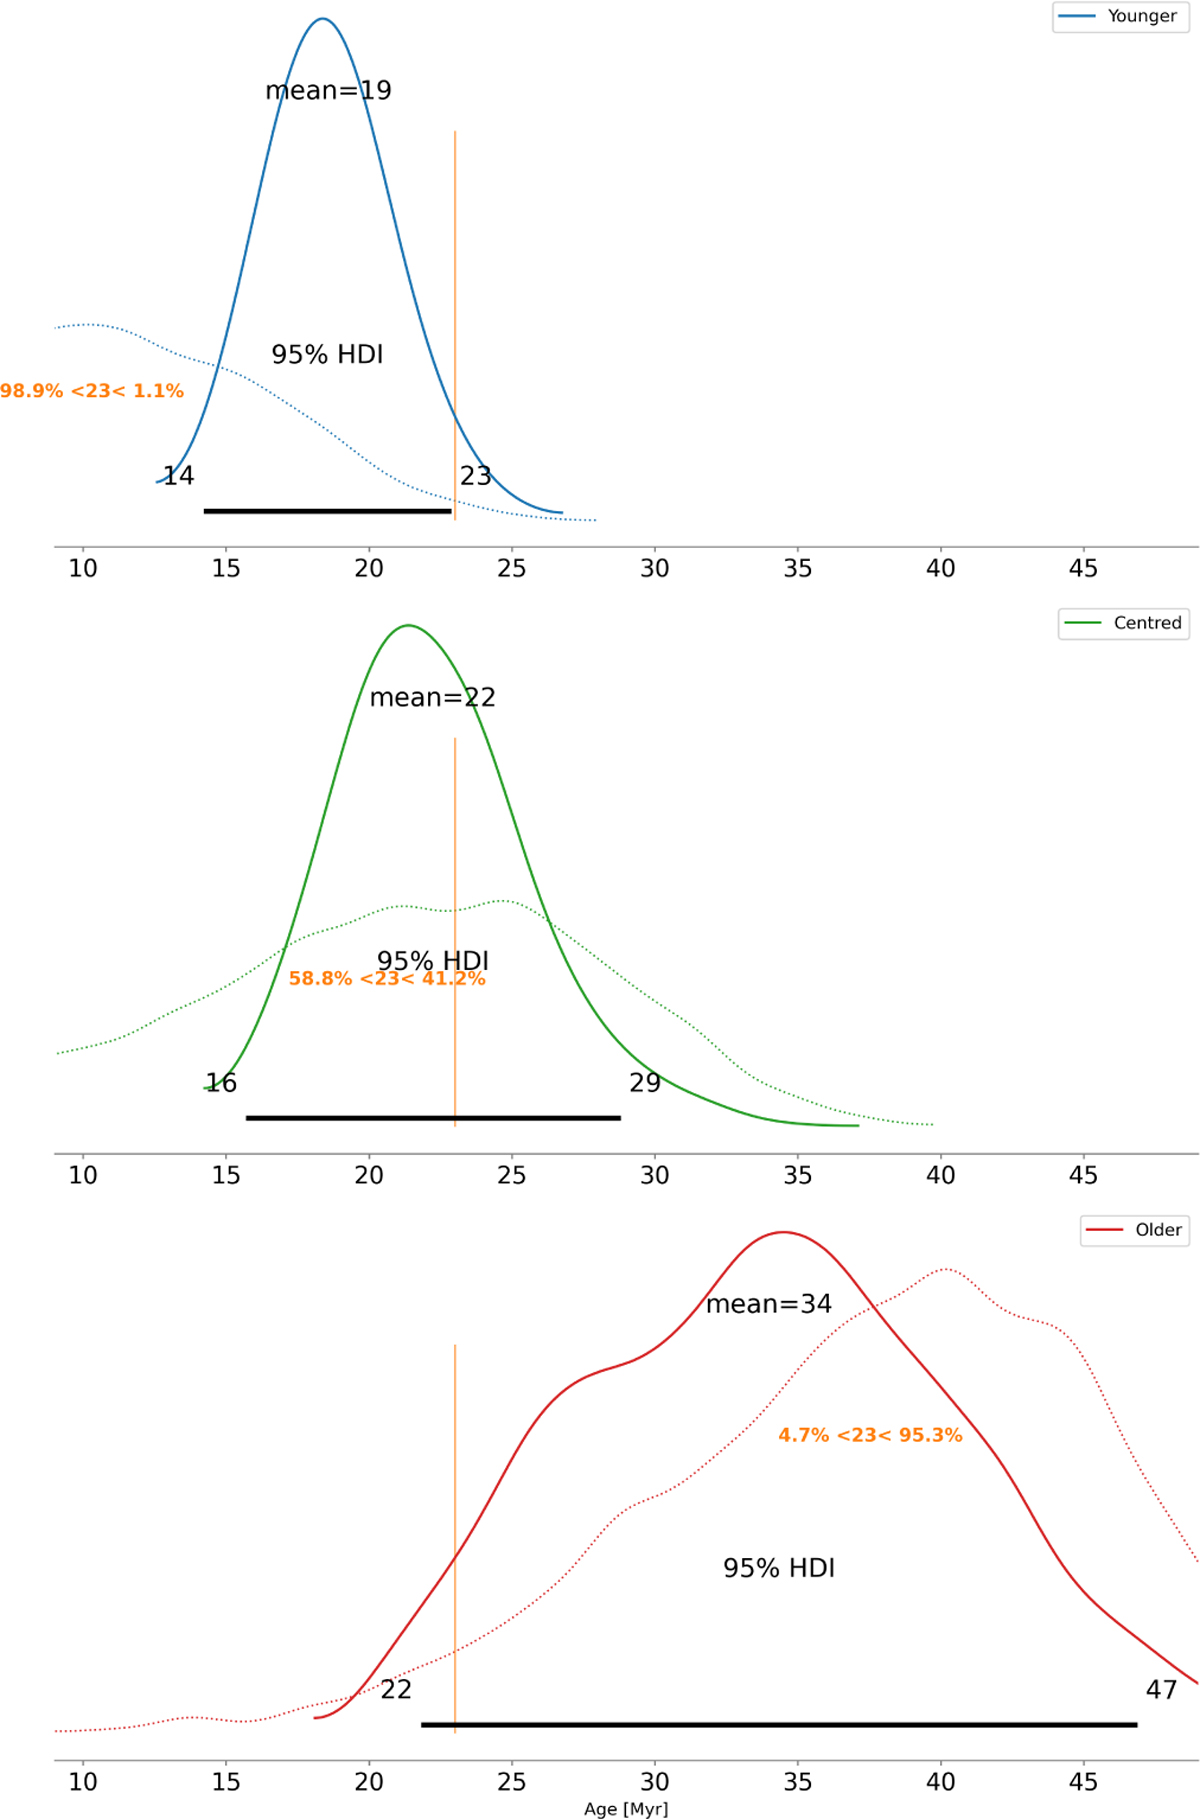
Examples of prior’s influence on the posterior for the case of a realisation of the β-Pictoris template with 25 sources and fully observed radial velocities. The panels show kernel density estimates of the prior (dotted lines) and posterior (solid lines) distributions for the cases in which the prior is younger than (upper panel, µτ = 10 Myr), centred at (mid panel, µτ = 23 Myr), and older than (lower panel, µτ = 40 Myr) the system’s true age of 23 Myr (vertical orange lines). In all cases, the prior dispersion is στ = 8 Myr. The mean and 95% HDI of the posterior are also shown in the black text, while the orange text shows the percentages of the prior distribution that lay below and above the true age.
Current usage metrics show cumulative count of Article Views (full-text article views including HTML views, PDF and ePub downloads, according to the available data) and Abstracts Views on Vision4Press platform.
Data correspond to usage on the plateform after 2015. The current usage metrics is available 48-96 hours after online publication and is updated daily on week days.
Initial download of the metrics may take a while.