Fig. 6
Download original image
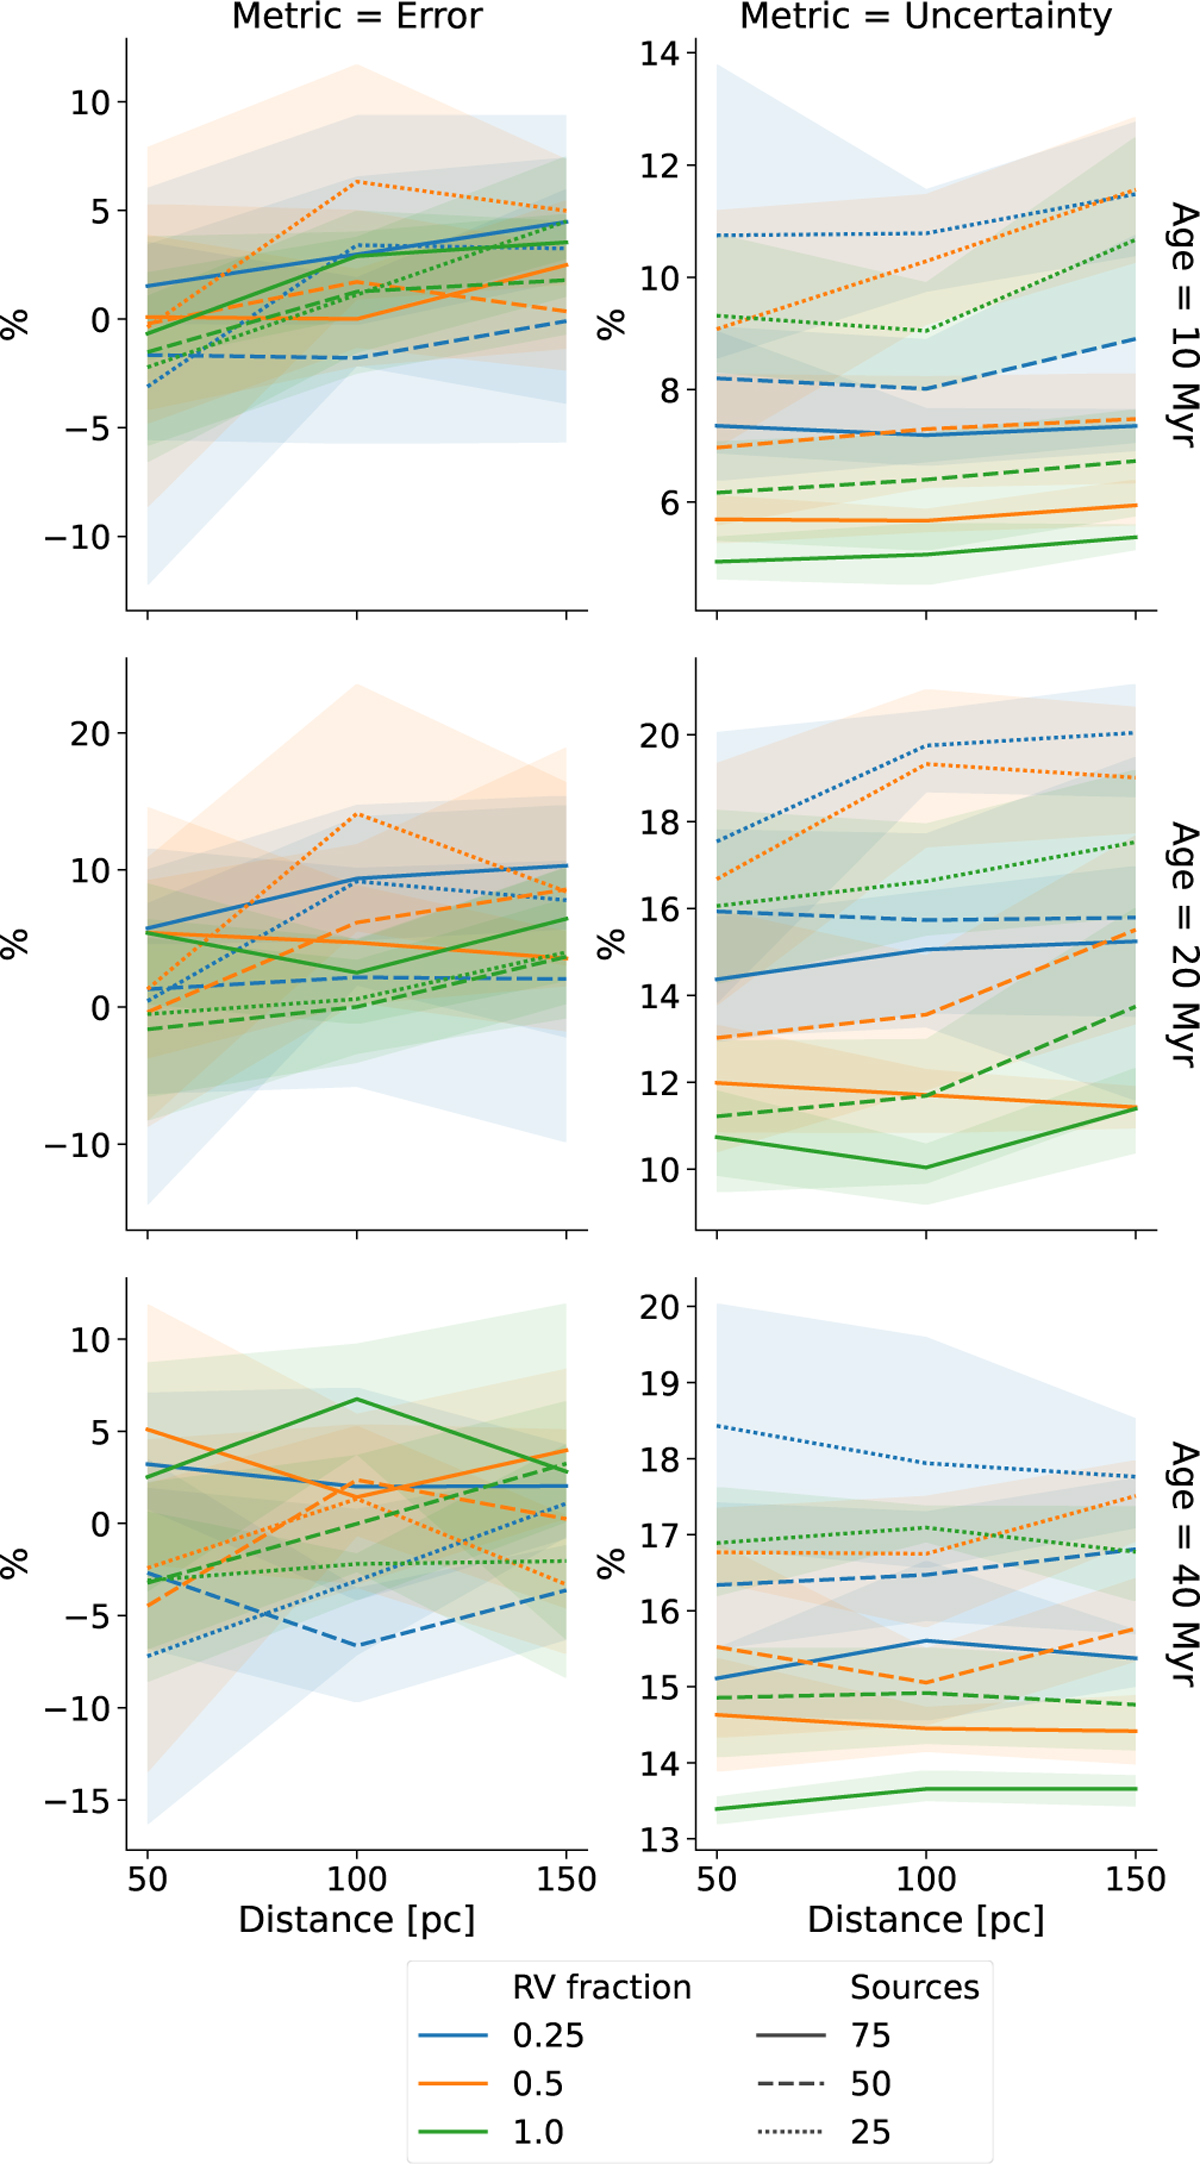
Age metrics of synthetic associations as a function of distance, grouped by age (rows) and colour-coded by number of sources; line style shows the fraction of observed radial velocities. The lines and shaded regions depict the mean and standard deviation of the five synthetic simulations corresponding to each case. To save space, the credibility, which is always 100%, is not shown.
Current usage metrics show cumulative count of Article Views (full-text article views including HTML views, PDF and ePub downloads, according to the available data) and Abstracts Views on Vision4Press platform.
Data correspond to usage on the plateform after 2015. The current usage metrics is available 48-96 hours after online publication and is updated daily on week days.
Initial download of the metrics may take a while.