Fig. 2.
Download original image
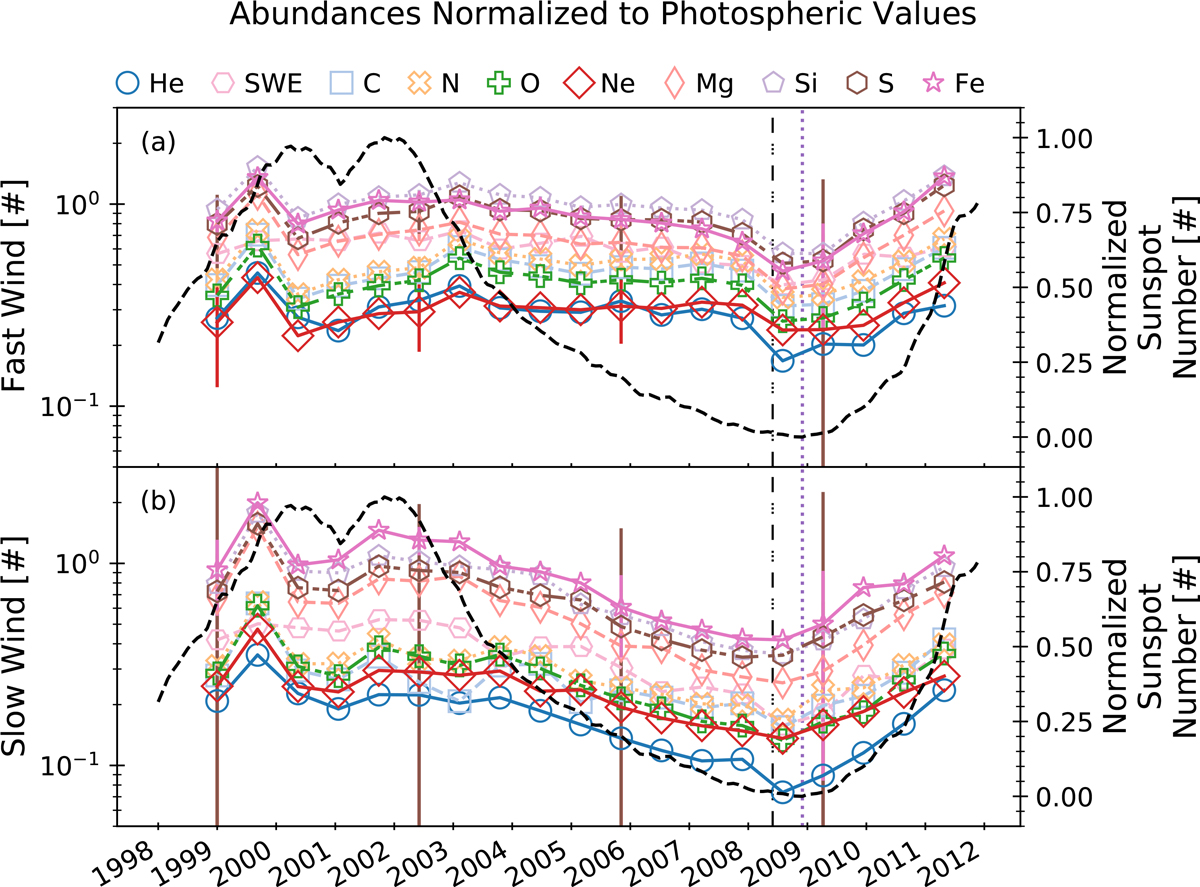
SWICS abundances normalized to their photospheric values in (a) fast and (b) slow wind as a function of time, aggregated in 250-day intervals. The right axes plots the normalized 13-month smoothed sunspot number. The SWE abundances normalized to its photospheric values are plotted for reference. The vertical dotted lines indicate solar minimum 24. The vertical dash-dotted line indicates the helium shutoff (Alterman et al. 2021).
Current usage metrics show cumulative count of Article Views (full-text article views including HTML views, PDF and ePub downloads, according to the available data) and Abstracts Views on Vision4Press platform.
Data correspond to usage on the plateform after 2015. The current usage metrics is available 48-96 hours after online publication and is updated daily on week days.
Initial download of the metrics may take a while.