Fig. 1
Download original image
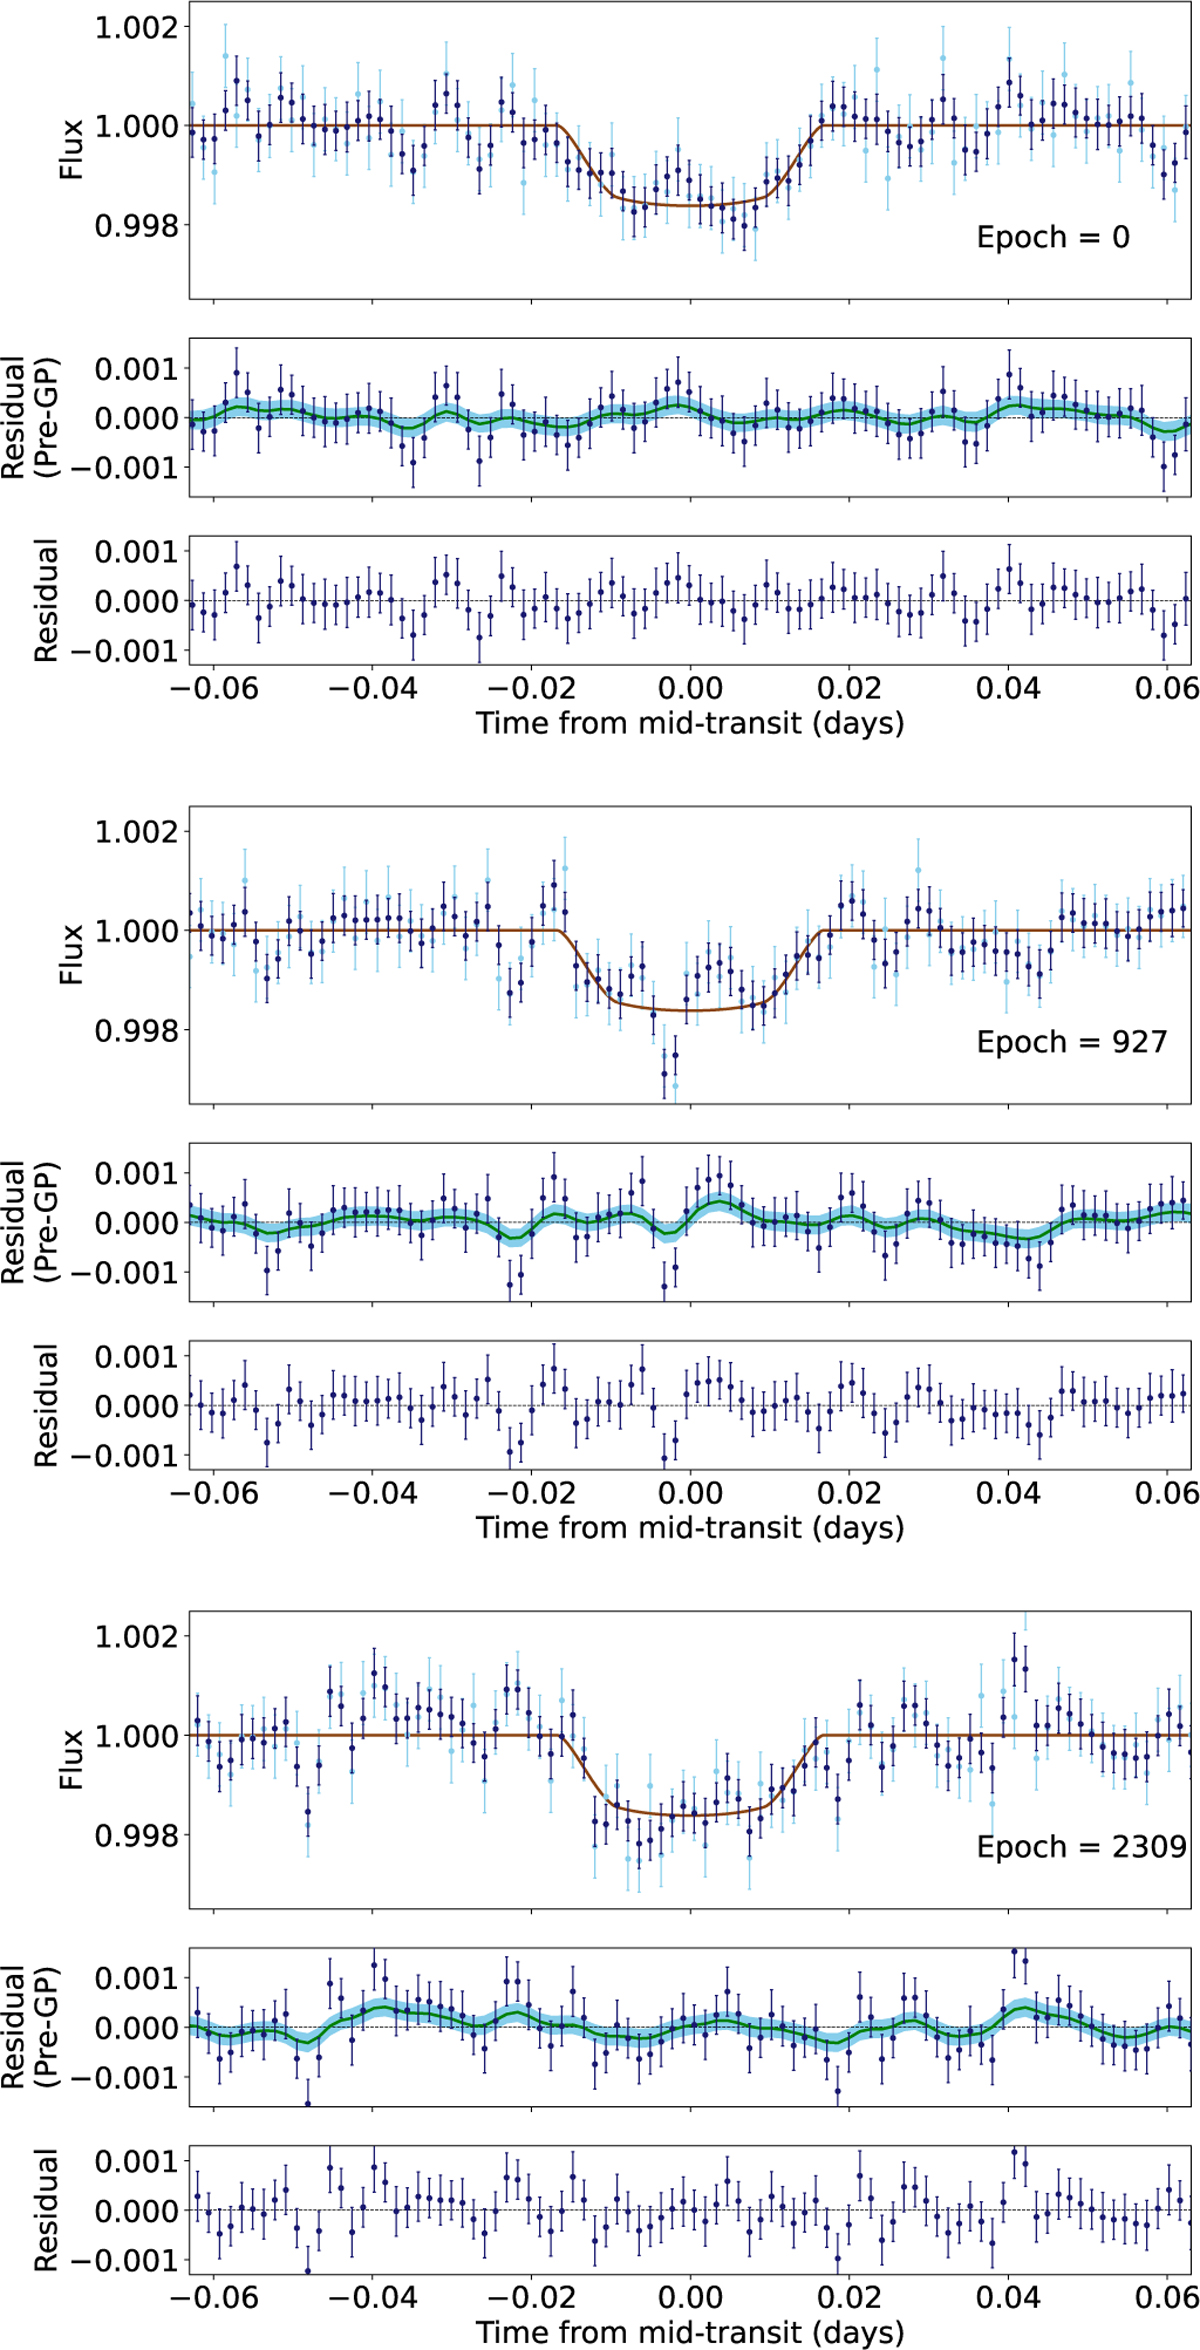
Observed and best-fit model light curves corresponding to the first transit observed from each TESS sector. For each transit, the top panel shows the unprocessed light curve (light blue), the light curve after wavelet denoising (blue), and the best-fit transit model (brown); the middle panel shows the residual flux before GP regression (blue), and the mean (green) and 1 σ interval (light blue) of the best-fit GP regression model; and the bottom panel shows the final mean residual flux (blue). The mean residual flux corresponds to the residual flux considering the mean of the best-fit GP regression model.
Current usage metrics show cumulative count of Article Views (full-text article views including HTML views, PDF and ePub downloads, according to the available data) and Abstracts Views on Vision4Press platform.
Data correspond to usage on the plateform after 2015. The current usage metrics is available 48-96 hours after online publication and is updated daily on week days.
Initial download of the metrics may take a while.