Fig. 2
Download original image
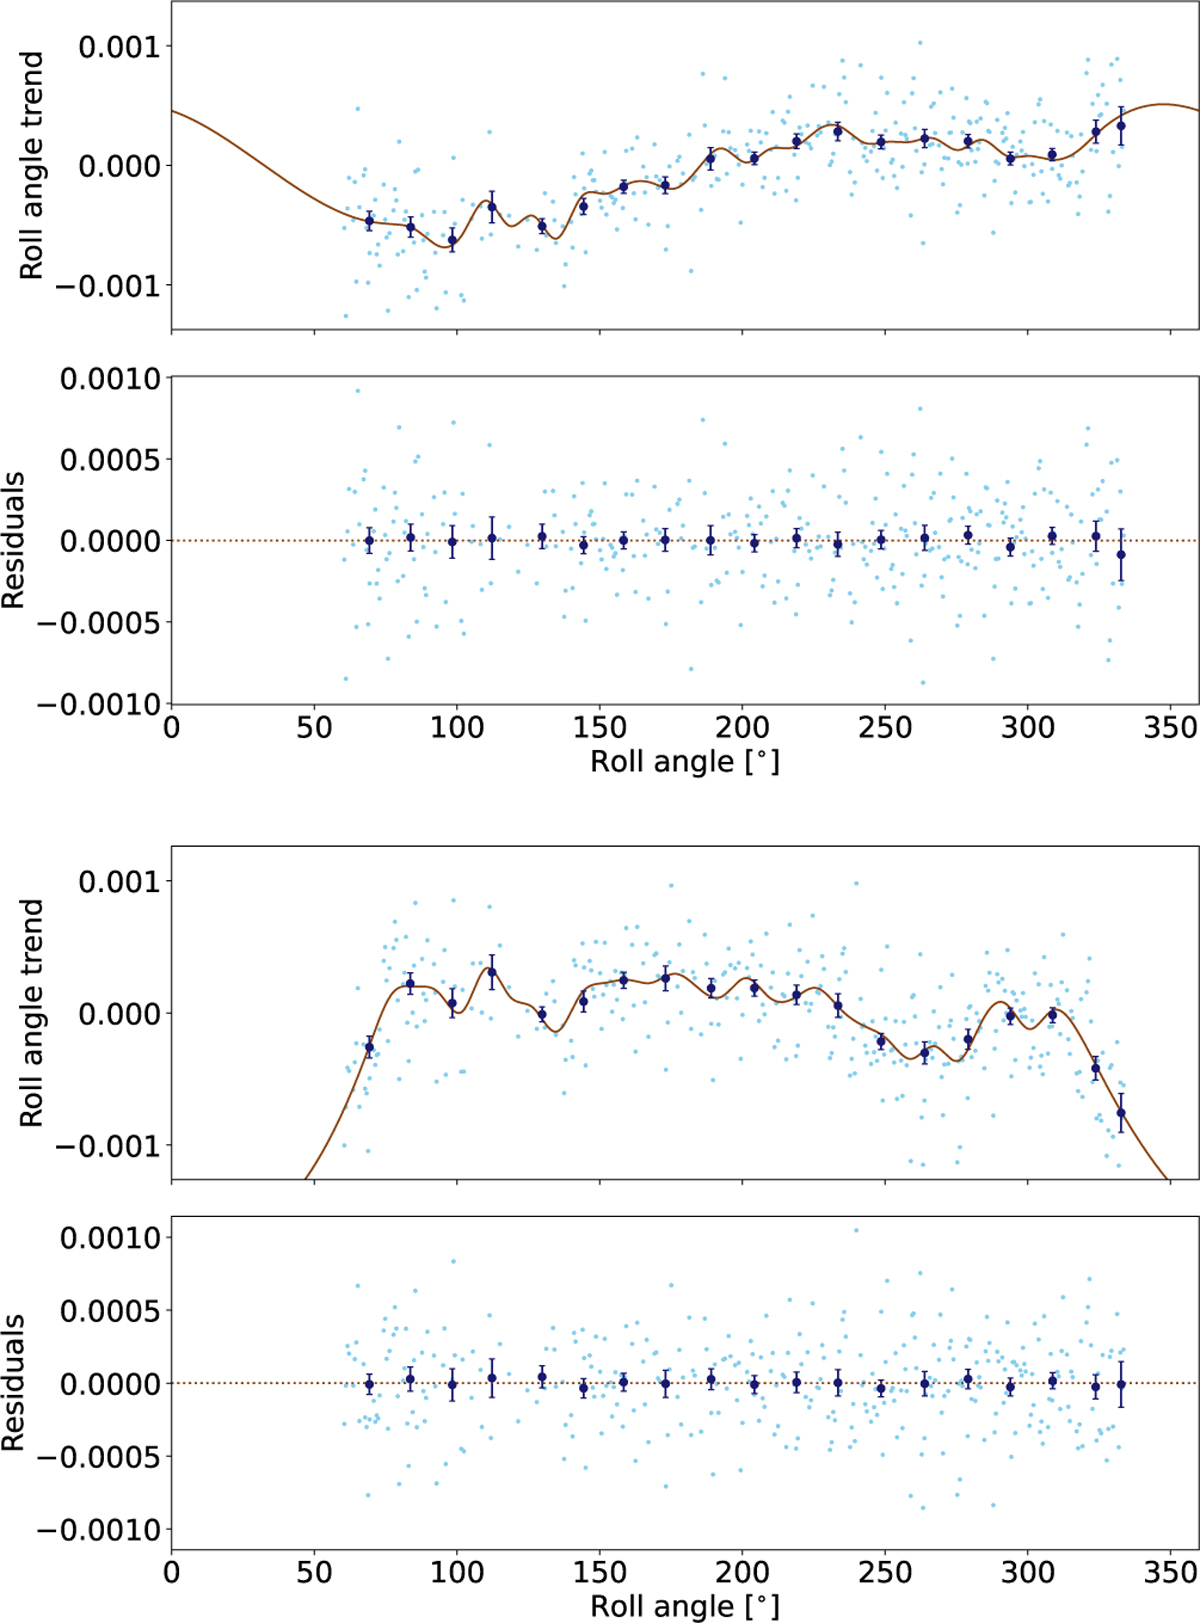
Trends in the background flux variations with respect to the roll-angle for the CHEOPS observation corresponding to epoch 1889, from the light curves reduced by the DRP (top) and PIPE (bottom). The light blue points show individual observations (without uncertainties), and the blue points show data binned over 15° intervals. It is worth noting that the trend of variation is different between the light curves reduced using the DRP and PIPE, since PIPE has a different sensitivity to background stars that contaminate the photometric apertures in the DRP outputs.
Current usage metrics show cumulative count of Article Views (full-text article views including HTML views, PDF and ePub downloads, according to the available data) and Abstracts Views on Vision4Press platform.
Data correspond to usage on the plateform after 2015. The current usage metrics is available 48-96 hours after online publication and is updated daily on week days.
Initial download of the metrics may take a while.