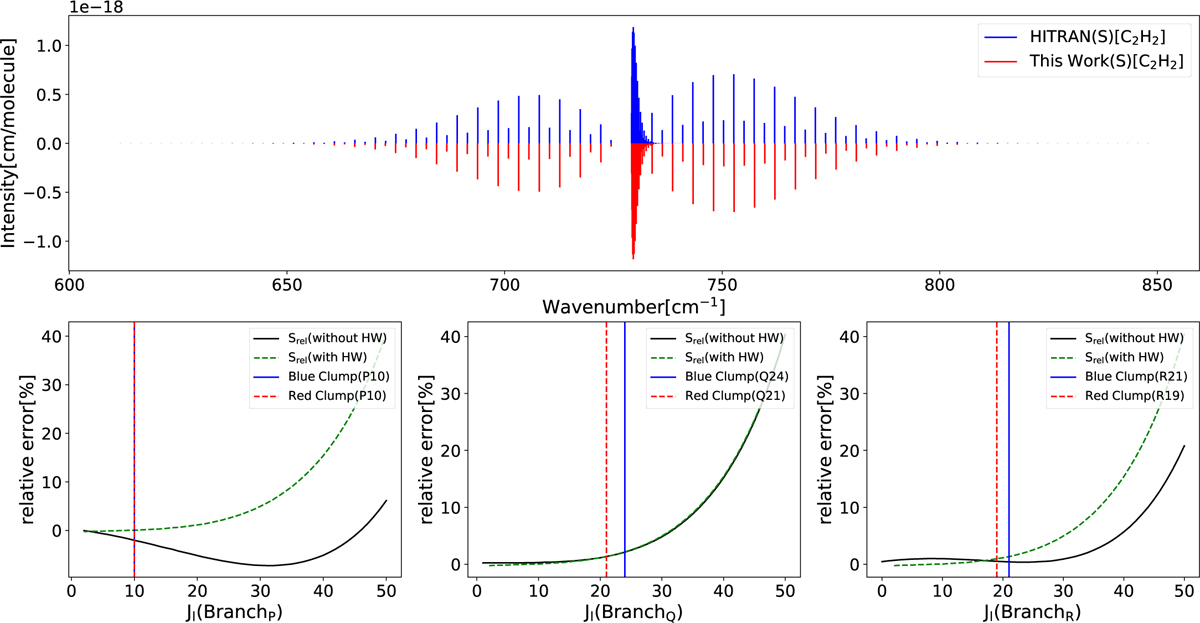
Fig. F.1
Download original image
Comparison of line intensities in the ν5 band of C2H2 between HITRAN data (blue) and the present calculations using TOPSEGI (red). The top panel shows the full simulated band profile in terms of line intensity versus wavenumber, illustrating overall agreement in line positions and relative strengths. The bottom three panels display the relative intensity errors as a function of rotational quantum number Jl in the P, Q, and R branches, respectively. The deviation increases toward high-Jl lines, but this is consistent with limitations in the HITRAN reference intensities and the harmonic dipole approximation used in the present model. Here, the vertical lines identify the highest-Jl observed, with corresponding deviations reaching up to approximately 2%.
Current usage metrics show cumulative count of Article Views (full-text article views including HTML views, PDF and ePub downloads, according to the available data) and Abstracts Views on Vision4Press platform.
Data correspond to usage on the plateform after 2015. The current usage metrics is available 48-96 hours after online publication and is updated daily on week days.
Initial download of the metrics may take a while.