Fig. 2
Download original image
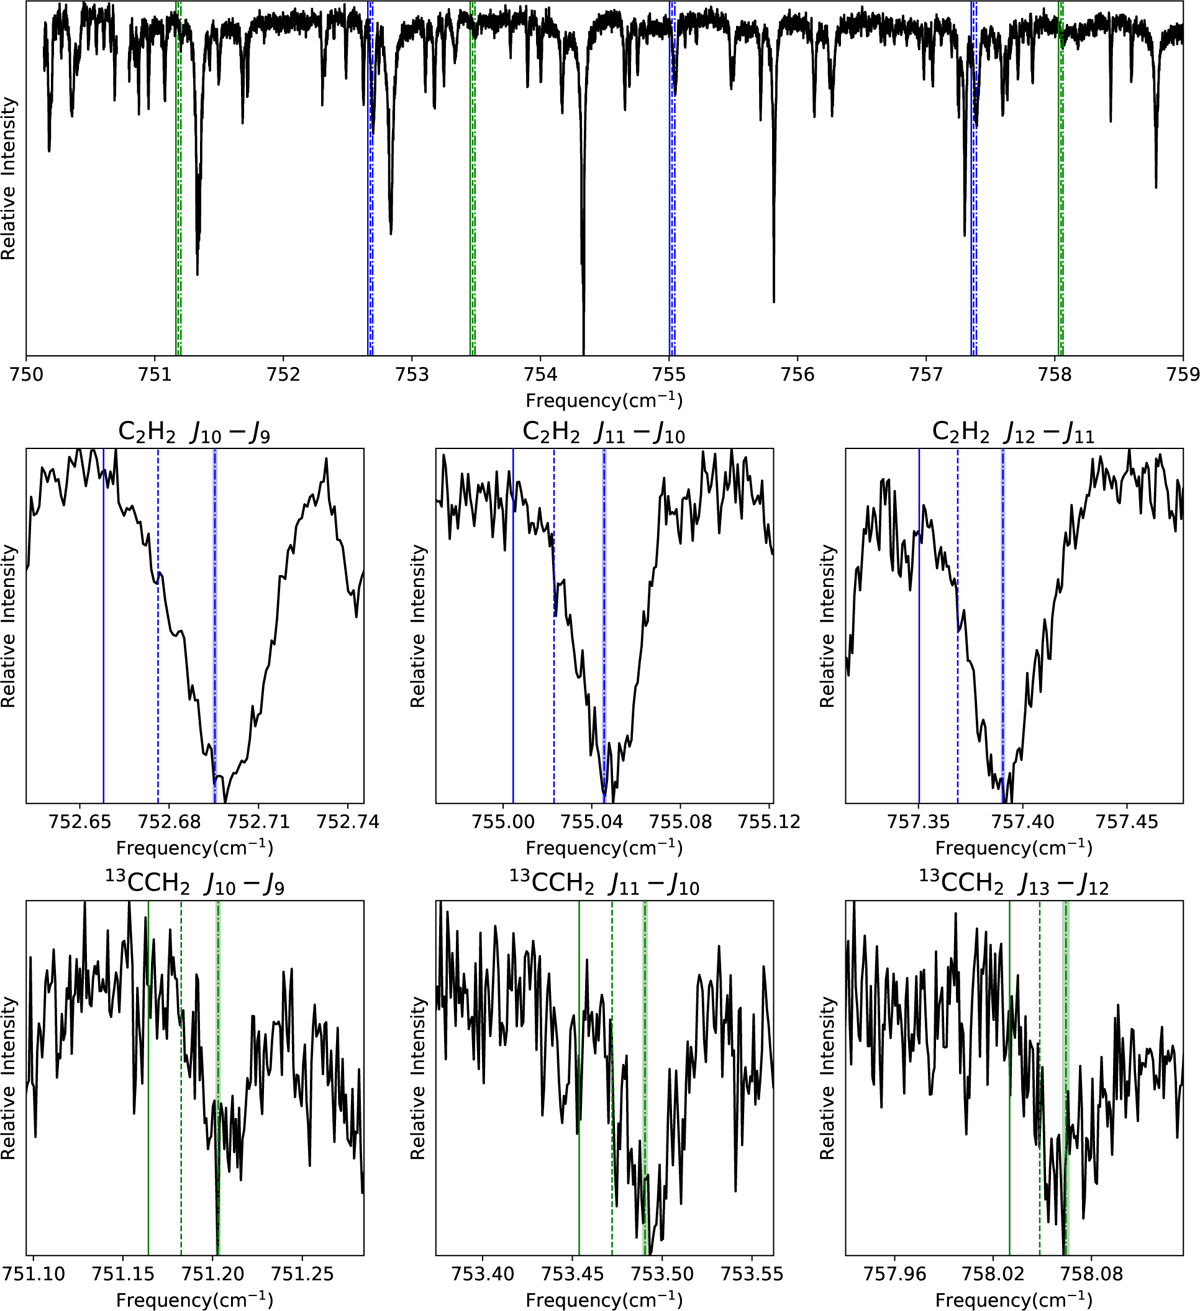
Mid-infrared spectra of IRc2 near the Orion Nebula (M42 or NGC 1976). Upper panel: SOFIA observational data (black lines). Middle panel: C2H2 absorption lines corresponding to R-branch. Lower panel: 13CCH2 absorption lines corresponding to R-branch. Vertical lines correspond to the HITRAN database (solid), the LSR corrections (dashed), and corrections for both the LSR and Doppler effects (dash-dotted). The shading around the dash-dotted lines represents the error associated with the transformation to the LSR.
Current usage metrics show cumulative count of Article Views (full-text article views including HTML views, PDF and ePub downloads, according to the available data) and Abstracts Views on Vision4Press platform.
Data correspond to usage on the plateform after 2015. The current usage metrics is available 48-96 hours after online publication and is updated daily on week days.
Initial download of the metrics may take a while.