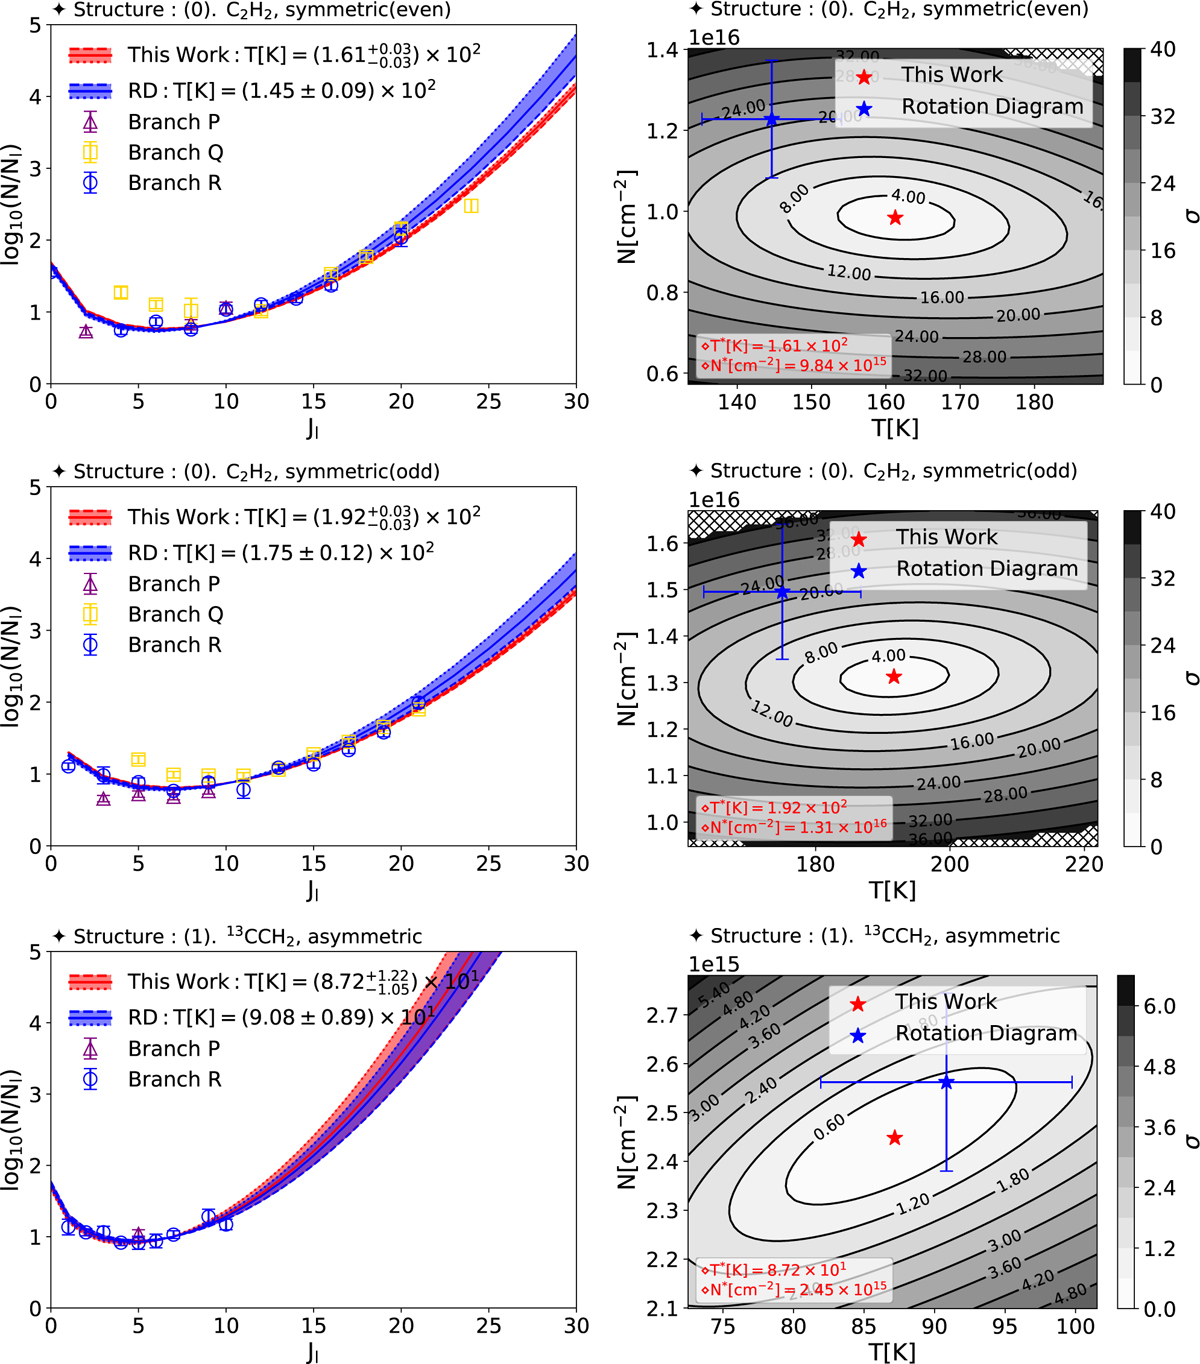
Fig. 3
Download original image
Analysis of the ν5 band of C2H2 and 13CCH2 using the RD and the χ2 fitting methods. Left panels: plot of log10 (Nl/gl) as a function of the lower rotational quantum number Jl, Right panels: contour plots from the χ2 method. In the left panels, purple triangles, yellow rectangles, and blue circles indicate observational results for the P-, Q-, and R-branches, respectively, based on the Nickerson et al. (2023) study of Orion IRc2. Each point includes 1σ error bars. The blue shaded regions represent the 1σ uncertainty range for the RD method, with the blue solid line showing the best-fit result. The red line represents results from the χ2 method, providing more precise estimates of physical parameters. The right panels display contour plots illustrating the confidence intervals for the χ2 method with two degrees of freedom, temperature (K) and column density (molecules per square centimeter). The contours depict the difference between observed and theoretical lower-state column densities (Nl), with the minimum value indicating the best-fit parameters. The red star marks the best-fit temperature and column density from the χ2 method, while blue stars with error bars denote the RD best-fit values with 1σ uncertainties. Contour levels correspond to confidence levels, and the explicit best-fit values of T and N are displayed in red in the lower-left corner. These results emphasize the improved accuracy of the χ2 fitting method (right panels) compared to the RD approach (left panels) in determining the physical properties of the blue clump component. Additionally, the X-shaped hatching in the right panels indicates regions where ∆χ2 is too large, making numerical calculations infeasible.
Current usage metrics show cumulative count of Article Views (full-text article views including HTML views, PDF and ePub downloads, according to the available data) and Abstracts Views on Vision4Press platform.
Data correspond to usage on the plateform after 2015. The current usage metrics is available 48-96 hours after online publication and is updated daily on week days.
Initial download of the metrics may take a while.