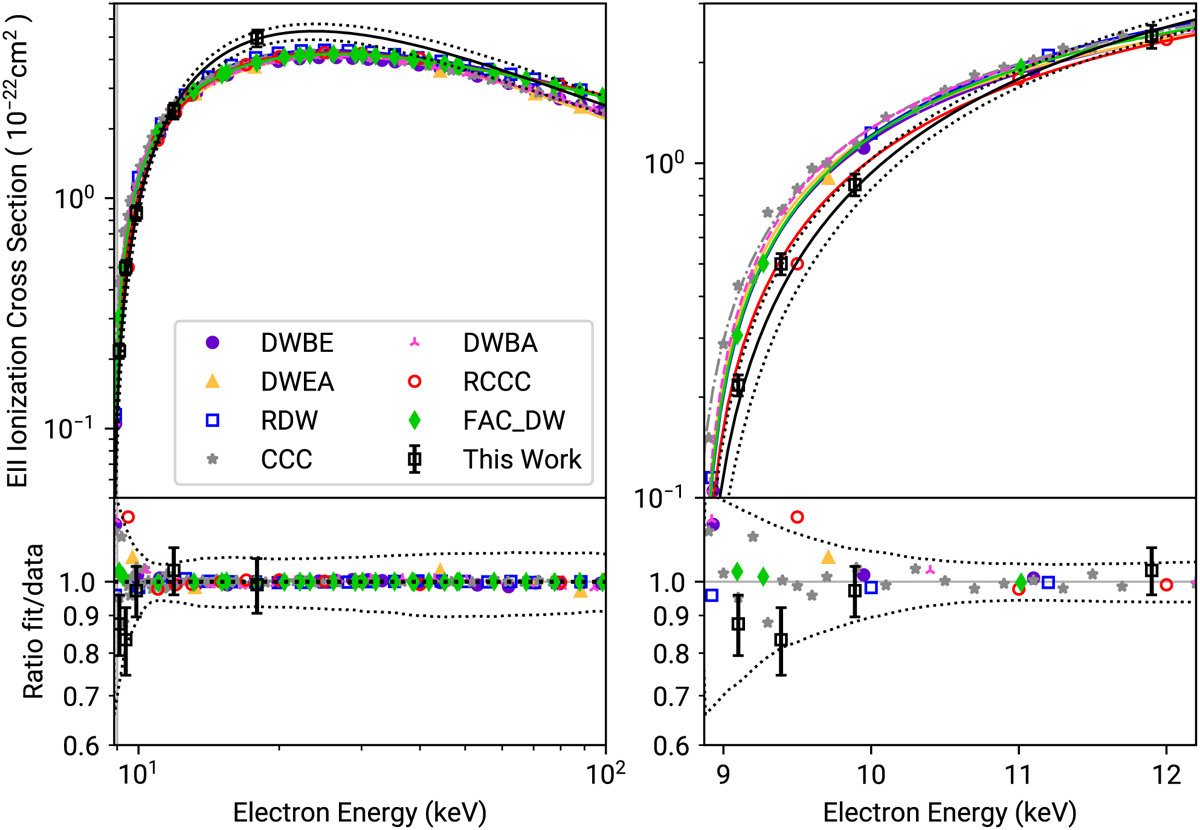
Fig. 2
Download original image
Top-left: experimental cross sections from this work (black), along with theoretical calculations (see Sect. 7.1 for descriptions) and fits to them using Eq. (2) of Urdampilleta et al. (2017, solid lines). Bottom-left: ratios of the cross sections returned by the fitted curve to the calculated data points. The 1σ uncertainties on the experimental results are shown as dotted lines. Right: same but zoomed in on the low-energy region.
Current usage metrics show cumulative count of Article Views (full-text article views including HTML views, PDF and ePub downloads, according to the available data) and Abstracts Views on Vision4Press platform.
Data correspond to usage on the plateform after 2015. The current usage metrics is available 48-96 hours after online publication and is updated daily on week days.
Initial download of the metrics may take a while.