| Issue |
A&A
Volume 700, August 2025
|
|
|---|---|---|
| Article Number | A263 | |
| Number of page(s) | 9 | |
| Section | Interstellar and circumstellar matter | |
| DOI | https://doi.org/10.1051/0004-6361/202554332 | |
| Published online | 26 August 2025 | |
Experimental electron impact ionization cross sections of Fe XXV and Maxwellian-averaged rate coefficients
1
Deutsches Elektronen Synchrotron DESY,
Platanenallee 6,
15738
Zeuthen,
Germany
2
Department of Physics and Astronomy, Clemson University,
Clemson,
SC
29634,
USA
3
Associate, National Institute of Standards and Technology,
Gaithersburg,
MD
20899,
USA
4
Center for Astrophysics | Harvard and Smithsonian,
Cambridge,
MA
02138,
USA
5
National Institute of Standards and Technology,
Boulder,
CO
80305,
USA
6
Northern Arizona University,
Flagstaff,
AZ
86011,
USA
7
National Institute of Standards and Technology,
Gaithersburg,
MD
20899,
USA
8
Department of Physics, University of Colorado,
Boulder,
CO
80309,
USA
★ Corresponding author: This email address is being protected from spambots. You need JavaScript enabled to view it.
Received:
28
February
2025
Accepted:
15
July
2025
Abstract
Context. Collisionally ionized plasmas produce X-ray spectra that depend on electron energy and atomic processes, requiring accurate atomic rate coefficients for modeling. While most data are theoretical, experimental measurements – such as those for Fe XXV – are critical for providing important benchmarks and quantifying uncertainties, thereby improving astrophysical spectral analysis, especially with high-resolution observatories like XRISM.
Aims. This study aimed to experimentally measure the electron impact ionization (EII) cross section of Fe XXV, a key ion in astrophysical plasma diagnostics, and to evaluate the impact of these measurements on the interpretation of X-ray spectra from high-temperature plasma environments.
Methods. The EII cross sections were measured using X-ray spectroscopy with an electron beam ion trap (EBIT) at various electron beam energies. The intensity ratios of the w resonance line in Fe XXV and the Lyα1,2 lines in Fe XXVI were used to derive the cross sections. Level-resolved population calculations were performed using the NOMAD collisional-radiative code to account for processes affecting the emission ratios and ionization balance in the non-Maxwellian EBIT plasma.
Results. The measured EII cross sections show good agreement with relativistic convergent close-coupling calculations. The uncertainties in the measurements, ranging from 8% to 12%, are discussed in terms of their impact on the accuracy of temperature diagnostics for astrophysical plasma environments.
Key words: atomic data / atomic processes / plasmas
© The Authors 2025
 Open Access article, published by EDP Sciences, under the terms of the Creative Commons Attribution License (https://creativecommons.org/licenses/by/4.0), which permits unrestricted use, distribution, and reproduction in any medium, provided the original work is properly cited.
This article is published in open access under the Subscribe to Open model. This email address is being protected from spambots. You need JavaScript enabled to view it. to support open access publication.
1 Motivation
Collisionally ionized plasmas produce X-ray spectra that are highly dependent on the energy of the colliding electrons. Modeling such spectra requires atomic rate coefficients as functions of temperature for electron impact ionization (EII), dielectronic recombination (DR), electron impact excitation (EIE), and radiative recombination (RR) as well as radiative decay probabilities. Continuum emission, including bremsstrahlung, RR continuum, and two-photon emission, can also contribute to the spectrum. Extensive reviews have been conducted to compile the atomic data necessary for modeling astrophysical and fusion plasmas (see, e.g., Kallman & Palmeri 2007; Foster et al. 2012; Mendoza et al. 2021). Most atomic rates used to model astrophysical plasmas are derived from theoretical calculations, with few experimental benchmarks. In this work, we present the first experimental measurements of EII cross sections from an electron beam ion trap (EBIT) for the astrophysically important ion Fe XXV (He-like Fe24+).
The spectral features of Kα emission from highly charged Fe have been observed in various celestial sources due to the high relative abundance of iron, the high transition rates involved, and the low intergalactic absorption affecting these lines (Rudolph et al. 2013). These make Fe XXV Kα particularly compelling for the investigation of X-rays both from photoionized sources, such as high-mass X-ray binary stars and active galactic nuclei (Suryanarayanan et al. 2024; Nandra 2006), and from collisionally ionized sources, such as stellar flares, clusters of galaxies, and supernova shocks (Huenemoerder et al. 2010; Sanders & Fabian 2006; Yamaguchi et al. 2013). Therefore, EII cross sections of Fe XXV, required to model such spectra, have practical applications in interpreting astrophysical observations.
The successful launch and operation of advanced high-resolution X-ray observatories such as Chandra and XMM-Newton has provided the astrophysical community with a wealth of data with high enough signal-to-noise ratios to generate new evaluations of the accuracy and completeness of the atomic data needed for spectral analysis (Brickhouse & Drake 2000). The short-lived Hitomi mission (Takahashi et al. 2016) led to groundbreaking results at higher energies with the strong emission lines from He-like and H-like iron, whose features constrain the turbulent velocity and temperature in the Perseus cluster (Aharonian et al. 2016). Hitomi results also showed that the lack of adequate, accurate atomic data limits the modeling of observed line intensities and the derivation of plasma conditions (Hitomi Collaboration 2018c,a). With the recent launch of the JAXA/NASA X-ray Imaging and Spectroscopy Mission (XRISM; Tashiro et al. 2018), we expect an explosion of studies with high spectral resolution at higher energies. It seems likely that the most significant uncertainties will no longer be statistical or instrumental but may instead be limited by the atomic rate and wavelength uncertainties involved (Hitomi Collaboration 2018b). XRISM carries the Resolve microcalorimeter on board, with an energy resolution of ΔE ≈ 5 eV, which is optimal for studies of the Fe K region around 6.7 keV (XRISM Collaboration 2024a,b). Early XRISM observations of the supernova remnant N132D show strong emissions from Fe XXV and Fe XXVI with different spatial distributions, suggesting their origin is in an ionizing plasma (XRISM Collaboration 2024a).
2 Electron impact ionization background
For the case of low-Z ions, a nonrelativistic quantum theory is applicable for describing ionization processes while semi-empirical formulas such as those proposed by Lotz (1967) can be used for simple estimates. However, relativistic theory becomes essential for high-Z ions, and the contributions of quantum electrodynamics (QED) effects become more significant as the charge state increases. A great deal of theoretical modeling effort has been put forward to calculate the EII cross section of Fe XXV (see, e.g., Zhang & Sampson 1990; Younger 1982; Fang et al. 1995; Fursa et al. 2016), ranging from simple semi-empirical formulas to sophisticated relativistic convergent close-coupling (RCCC), and different calculations often produce inconsistent values (Marrs et al. 1997). Heuer et al. (2021) present uncertainties in EII cross sections, based on their literature search, for other Fe L-shell ions ranging from 13% to 40%. Accurate values of EII cross sections are essential for the detailed understanding of high temperature plasma environments, and particularly important for interpreting the charge state distribution of ions within the plasma (Paerels & Kahn 2003; Stella & Campana 1991).
Measurements of different EII cross sections have been carried out in EBITs, merged and crossed beam facilities, and ion storage ring facilities (Beiersdorfer 2003; Linkemann et al. 1995; Gregory et al. 1990; Stenke et al. 1999). EBIT devices can create desired charge states in a controlled manner that are usually higher than those available through other approaches.
Here, we report the first measurement of EII cross sections of Fe XXV. We took advantage of a broadband, high-resolution transition-edge sensor (TES) X-ray spectrometer on the EBIT at the National Institute for Standards and Technology (NIST). Theoretical values calculated with different methods have been compared with our experimental results. The measured data have been converted to Maxwellian rate coefficients for comparison with data used in astrophysical databases, and we assessed the uncertainties measured on the temperature diagnostics capabilities of these spectra on astrophysical plasma.
3 Role of EII in the EBIT charge state balance
At electron beam energies above the ionization threshold of Fe XXV, a highly charged iron ion cloud is created and trapped in the EBIT where it quickly reaches charge state equilibrium. The EII of Fe XXV is balanced by the recombination processes that create He-like ions from H-like ions (Penetrante et al. 1991).
At electron impact energies away from DR resonances, the recombination processes relevant in EBIT plasma environments are RR and charge exchange recombination (CX) (Marrs et al. 1997; Currell & Fussmann 2005). Due to low heavy-particle temperatures in the trap the Coulomb barrier prevents ion-ion charge exchange, and at typical EBIT electron densities (≲1012 cm−3), three-body recombination is negligible. The number density n0 of neutral atoms involved in the charge exchange process corresponds primarily to molecular nitrogen (N2), present as a low-level residual background gas in the NIST EBIT vacuum chamber. This residual gas arises from a small, unintentional leak between the liquid nitrogen cooling lines and the vacuum chamber at cryogenic temperatures, providing a consistent, low-level source of nitrogen as documented by (Gillaspy et al. 1997).
The balance equation for the total ion populations can thus be presented as
![Mathematical equation: $\[n_e v N_{H e} \sigma_{H e}^{E I I}=n_e v N_H \sigma_H^{R R}+n_o v_r N_H \sigma_H^{C X},\]$](/articles/aa/full_html/2025/08/aa54332-25/aa54332-25-eq1.png) (1)
(1)
where ne is the average electron number density and v is the average velocity of the electron beam, ![Mathematical equation: $\[\sigma_{H e}^{E I I}\]$](/articles/aa/full_html/2025/08/aa54332-25/aa54332-25-eq2.png) is the EII cross section of He-like ions, NHe is the number density of He-like ions and NH is the number density of H-like ions,
is the EII cross section of He-like ions, NHe is the number density of He-like ions and NH is the number density of H-like ions, ![Mathematical equation: $\[\sigma_{H}^{R R}\]$](/articles/aa/full_html/2025/08/aa54332-25/aa54332-25-eq3.png) is the total RR cross section of H-like ions, vr is the average relative velocity between the no number density of neutral atoms and the recombining ions in the trap, and
is the total RR cross section of H-like ions, vr is the average relative velocity between the no number density of neutral atoms and the recombining ions in the trap, and ![Mathematical equation: $\[\sigma_{H}^{C X}\]$](/articles/aa/full_html/2025/08/aa54332-25/aa54332-25-eq4.png) is the total charge exchange cross section of H-like ions. Strictly speaking, the σv products should be averaged over the particle energy distribution function; however, since the electron beam is almost mono-energetic, it suffices to take it as a δ function.
is the total charge exchange cross section of H-like ions. Strictly speaking, the σv products should be averaged over the particle energy distribution function; however, since the electron beam is almost mono-energetic, it suffices to take it as a δ function.
The relative abundance of He-like and H-like charge states can be determined from the measured relative intensity of the He-like w line (1s2 1S0 − 1s2p 1P1) and H-like Lyα1,2 (1s 2S1/2 − 2p 2P1/2 and 1s 2S1/2 − 2p 2P3/2) lines. Assuming that direct excitation (DE) dominates the population of the upper levels of these transitions, the coronal equilibrium condition dictates that
![Mathematical equation: $\[\frac{N_{\mathrm{He}}}{N_{\mathrm{H}}}=\frac{I_w}{I_{L y \alpha}} \frac{\sigma_{L y \alpha}^{D E}}{\sigma_w^{D E}},\]$](/articles/aa/full_html/2025/08/aa54332-25/aa54332-25-eq5.png) (2)
(2)
where I is the intensity of the measured spectral line, and σDE is the EIE cross section directly from the ground state. We performed collisional radiative calculations using the NOMAD package (Ralchenko & Maron 2001) to verify this assumption. The contribution of DE to the population of the upper levels of these transitions ranges from 89% to 94%.
Combining Eqs. (1) and (2), the EII cross section of He-like ions can thus be derived from the RR cross section ![Mathematical equation: $\[\sigma_{H}^{R R}\]$](/articles/aa/full_html/2025/08/aa54332-25/aa54332-25-eq6.png) and DE cross section σDE, the measured line intensity ratio
and DE cross section σDE, the measured line intensity ratio ![Mathematical equation: $\[\frac{I_{w}}{I_{L y \alpha}}\]$](/articles/aa/full_html/2025/08/aa54332-25/aa54332-25-eq7.png) , and a single set of electron beam and charge exchange related parameters of the EBIT source as follows:
, and a single set of electron beam and charge exchange related parameters of the EBIT source as follows:
![Mathematical equation: $\[\sigma_{H e}^{E I I}=\frac{I_{L y \alpha}}{I_w} \frac{\sigma_w^{D E}}{\sigma_{L y \alpha}^{D E}}\left(\sigma_H^{R R}+\frac{n_0 v_r \sigma_H^{C X}}{n_e v}\right).\]$](/articles/aa/full_html/2025/08/aa54332-25/aa54332-25-eq8.png) (3)
(3)
In the upcoming sections, we show that the uncertainties associated with the physical parameters on the right-hand side of Eq. (3) allow us to determine the EII cross section accurately and make a critical comparison with theoretical calculations.
4 Measurement details
The X-ray spectra used for the determination of the Fe XXV EII cross sections were measured using the NIST EBIT (Gillaspy 1997). This device uses a compressed and energy-tunable electron beam to trap, ionize, and excite the injected atoms and ions for spectroscopic study. The key components of the NIST EBIT include the electron gun (e-gun), drift tubes (trap), and collector assemblies. The e-gun, drift tubes, and collector are aligned along the axis of a magnetic field up to 2.7 T created by a LHe-cooled superconducting magnet (SCM). This magnetic field compresses the electron beam to a radius of about 35 μm and enhances its electron density up to ~1012 electrons/cm3. The quasi mono-energetic electron beam (the width of the electron energy distribution is about 40 eV full width at half maximum) in the trap region is emitted from a 3 mm diameter, barium-doped, spherical cathode at the e-gun platform and travels through the trap as it reaches the collector.
During our measurements Fe ions were injected from a metal vapor vacuum arc (MeVVA) ion source (Holland et al. 2005) located on top of the vertically oriented EBIT. Ions created by a triggered spark were directed by the applied electric fields into the center of the trap region, along the magnetic field lines of the SCM, and were then further ionized to highly charged states by EII within the trap. The highly charged Fe ions were trapped electrostatically in the axial direction by the relative voltages placed on the three drift tube electrodes. Radial trapping of positive ions is provided by the electron beam’s negative space-charge potential and the SCM.
The ion trap is formed by three cylindrical drift tube electrodes, which are mounted inside a shield electrode. The shield can reach voltages of up to 30 kV. For our measurements, the trapping voltage with respect to the shield electrode voltage was +250 V, 0 V, and +500 V for the upper, middle, and lower drift tubes, respectively. To capture the incoming MeVVA ions and prevent the accumulation of contaminating ions, such as barium from the e-gun, the voltage of the middle drift tube was increased to +400 V for 10 ms every 5 s, synchronized with the arrival of the ions. During this time, the shield voltage was temporarily set to match the MeVVA bias voltage (Holland et al. 2005).
Data were taken using a steady-state mode operation, in which the electron beam energy and current remain constant during measurements (Gall et al. 2019). The charge state and energy level population in the EBIT plasma reach stable equilibrium within a few hundred milliseconds after each dump and refill of the trap. The equilibrium condition was verified using the recorded photon arrival time data provided by the TES spectrometer.
The nominal electron beam energy is determined by the potential difference between the cathode of the e-gun and the middle drift tube in the trap. The actual electron beam energy is affected by the space-charge potential of the electron beam, including the neutralization of the electrons by the trapped ions (Levine et al. 1988; Porto et al. 2000). The space-charge correction was measured by comparing experimental and theoretical DR resonance beam energies (details described in Yang et al. 2023b). The electron beam current in those measurements was set to 100.0 mA.
The observations of X-ray photons emitted from highly charged Fe ions in the trap were made at 90° with respect to the direction of the electron beam using a TES X-ray spectrometer. The instrument is an array of 192 individual TES microcalorimeters and provides broadband spectral response and an energy resolution of better than 5 eV (full width at half maximum) for X-rays at a few keV (Szypryt et al. 2019). The measured spectra covered the broadband energy range roughly from 500 eV to 8000 eV. The calibration of the spectrometer was performed using Kα emission lines of Mg, Al, Fe, Co, and Ni produced by an external X-ray fluorescence source placed between the TES and the EBIT. X-ray spectra of Fe were acquired at nominal electron beam energies from 9.21 keV to 18.00 keV. The selected beam energies were between 4.5 and 8.8 times the Li-like Fe ionization potential of 2.046 keV (Sapirstein et al. 2011), and between 1.1 and 2.0 times the He-like Fe ionization potential of 8.828 keV (Artemyev et al. 2005).
5 Data evaluation
5.1 Experimental spectra
The measured spectra at five nominal electron beam energies from 9.21 keV to 18.00 keV are presented in Fig. 1. The collection times of each spectrum were between 2 and 3 hours. The spectra show emission lines from highly charged few-electron Fe ions. These include Li-like Fe XXIV transitions between 1.0 keV and 1.2 keV, He-like Fe XXV lines with lower charge state satellites between 6.6 keV and 6.7 keV, and H-like Fe XXVI Lyα lines between 6.9 keV and 7.0 keV. The major components of the He-like Fe XXV complex include resonance w, intercombination y, and forbidden x and z lines, all of which are resolved by the TES spectrometer. The observed line widths are limited by the detector energy resolution (~5 eV; Szypryt et al. 2019), which dominates over both the Doppler broadening of ~0.6 eV (Ezoe et al. 2021; Gillaspy 1996; Levine et al. 1988) and the natural line widths (Rudolph et al. 2013; Beiersdorfer et al. 2002) of these lines.
For the fitting procedure, Gaussian functions were used with widths of individual, non-blended lines constrained to be equal. Chi-square and residual plot analyses were used to confirm the goodness of the fits.
Intensities of the Li-like, He-like, and H-like lines used in the current analysis were derived from the area underneath the fitted Gaussian profiles. Atomic structure-related non-isotropic emission and population cascade feeding corrections (Dipti et al. 2020; Gall et al. 2020; Yang et al. 2023b) were on the order of 6–9% and 2–4%, with relative uncertainties of 10%. Detection-related corrections (quantum efficiency, window transmission) were on the order of 10–40% and were evaluated for each of the transitions involved (Szypryt et al. 2019). The relative uncertainty associated with these detector-related corrections was estimated as an upper limit of 3%. The uncertainties of both these corrections were included in the overall uncertainty budget; however, experimental uncertainties were dominated by the statistical uncertainty of the measured line intensities.
5.2 Line intensity ratios
The experimental intensity ratios between the w and each Lyα line as a function of nominal electron beam energies are listed in Table 1. As mentioned earlier, these ratios were corrected for radiative cascades and non-isotropic emission in EBIT. To account for both effects, we performed collisional-radiative modeling using NOMAD (Ralchenko & Maron 2001) with magnetic sublevel atomic kinetics. The model has been described in detail in our earlier work (Dipti et al. 2020) but for clarity a brief overview is provided here. The model included H-like to Be-like charge states and the atomic processes such as electron-impact excitation (de-excitation), radiative decay, ionization (three-body recombination), autoionization, dielectronic capture, and RR. The required atomic data were calculated with the Flexible Atomic Code (FAC; Gu 2008). Our calculations included about 2500 magnetic sublevels of configurations with single electron excitation up to principal quantum number n = 6 and doubly excited states with 1s electron excitation up to n = 3. In addition to allowed electric-dipole transitions within all configurations, forbidden transitions (M1, E2, and M2) and two-photon decay 1s2 1S0 − 1s2s 1S0 (2E1) and 1s 2S1/2 − 2s 2S1/2 (2E1) transitions were also considered. The calculations also took the depolarization effects due to spiral motion of the electrons into account (Dipti et al. 2020). To estimate the maximum depolarization, we used the optical approach developed by Herrmann (1958), which shows that the product of beam area and transverse temperature is constant. Based on this method, we calculated the transverse energy at the trap and the resulting pitch angle, and from these values we estimated the transverse velocity and the depolarization of the transitions.
In the case of Lyα2, the measured intensity also includes a small contribution from the magnetic dipole transition (M1) 1s1/2 − 2s1/2. The energy separation between the two transitions in iron is only 0.03 eV (Wong et al. 2002), which cannot be resolved in our spectrum. The upper energy level 2s1/2 decays through M1 radiation approximately 10% of the time, while the remaining 90% of the time, it decays through two-photon decays (Parpia & Johnson 1982). Our theoretical calculations predicted about 8% contribution due to M1 transition to the blended line intensity. In our analysis, the experimental intensity ratio of the w line to Lyα2 was also corrected for the M1 transition contribution.
The dominant correction in the intensity ratio of w to Lyα1 is due to polarization, as the resonance line in He-like Fe is more polarized compared to the one in H-like ions. The change in intensity ratio is larger for the unpolarized Lyα2 line. The uncertainties of the polarization of resonance lines is estimated to be about 10%, while the radiative transition probabilities of these highly charged ions can be calculated with an accuracy of about 5%. The total uncertainty due to these corrections was found to enter the experimental line ratio at a level of 0.1%. Table 1 shows the measured intensity ratios as well as the corrected ratios and their uncertainties. The total relative uncertainty for the w to Lyα2 ratio is about 1.5% to 3% larger than that for the w to Lyα1 ratio.
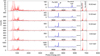 |
Fig. 1 Experimental spectra at five nominal electron beam energies from 9.21 keV to 18.00 keV. For easier visual identification of the major components of He-like Fe XXV complexes and H-like Fe XXVI Lyα lines, the inset spectra show the same experimental spectra with the photon energy range between 6500 eV and 7050 eV. In the inset spectra of 18.00 keV, the strongest resonance He-like Fe XXV w and the H-like Fe XXVI Lyα lines are indicated. |
Intensity ratio of He-like w to H-like Lyα lines of iron.
5.3 Assessment of electronic cross sections
Radiative recombination cross sections were obtained from the photoionization cross sections using the principle of detailed balance, as photoionization cross sections can generally be calculated to a much higher accuracy compared to electron-impact collision processes. This has been confirmed in earlier works where the results of theoretical calculations for the photoionization of atoms agree well within 3% of measured values, and they are anticipated to be better for highly charged ions (Saloman et al. 1988; Chantrenne et al. 1992).
Electron impact excitation cross sections for the w and Lyα lines were calculated using FAC (Gu 2008) based on the relativistic distorted-wave (RDW) approach. In Eq. (2), EIE cross sections appear as ratios, and the uncertainties for the relative cross sections are expected to largely cancel out, as theoretical approximations, such as missing non-perturbative close-coupling effects, influence the two cross sections similarly. This is evident in the ratios of the Born cross sections, which are known to be much closer to the true ratio values near the threshold energies, despite overestimating the absolute ones near the threshold. The reliability of the EIE cross sections can be estimated by evaluating the accuracy of the target structure that greatly affects subsequent electron impact collisional calculations. This can be done by comparing the oscillator strengths or line strengths with the experimental values (if available) or the critically evaluated datasets. In the present case, the oscillator strengths for the resonance transitions in H-like and He-like show a deviation of about 1.5% and 2%, respectively, from the NIST recommended values Kramida et al. (2024). Therefore, we estimated an overall uncertainty of 4% in the relative cross sections, which will also account for additional sources of uncertainties such as theoretical approximations and numerical convergence.
Electron impact ionization cross-section calculations of Li-like Fe XXIV were necessary to determine the ![Mathematical equation: $\[\frac{n_{0} v_{0} \sigma_{H}^{C X}}{n_{e} v}\]$](/articles/aa/full_html/2025/08/aa54332-25/aa54332-25-eq13.png) term spectroscopically as explained in the next section. The only measured ionization cross section for Fe XXIV we are aware of is from Wong et al. (1993) at a single energy of 4.66 keV, which is below the electron beam energies of our measurements. Our FAC calculated cross section at 4.66 keV agrees with the measurement of Wong et al. (1993), with a relative deviation of about 3%. The cross sections based on the RDW method generally agree better at higher energies than closer to the ionization threshold. Based on this assessment, the uncertainties of the ionization cross sections for Fe XXIV have been estimated to be less than 3%.
term spectroscopically as explained in the next section. The only measured ionization cross section for Fe XXIV we are aware of is from Wong et al. (1993) at a single energy of 4.66 keV, which is below the electron beam energies of our measurements. Our FAC calculated cross section at 4.66 keV agrees with the measurement of Wong et al. (1993), with a relative deviation of about 3%. The cross sections based on the RDW method generally agree better at higher energies than closer to the ionization threshold. Based on this assessment, the uncertainties of the ionization cross sections for Fe XXIV have been estimated to be less than 3%.
5.4 Treatment of charge exchange with neutrals
Charge exchange cross sections are difficult to measure or calculate, and their effects on astrophysical and laboratory plasmas need to be carefully assessed. With our current approach for determining the EII cross section, charge exchange effects are included in the ![Mathematical equation: $\[\frac{n_{0} v_{r} \sigma_{H}^{C X}}{n_{e} v}\]$](/articles/aa/full_html/2025/08/aa54332-25/aa54332-25-eq14.png) term of Eq. (3), along with other parameters related to experimental conditions. As detailed in Yang et al. (2025), we relied on the ratio
term of Eq. (3), along with other parameters related to experimental conditions. As detailed in Yang et al. (2025), we relied on the ratio ![Mathematical equation: $\[\frac{n_{0} v_{r} \sigma_{H e}^{C X}}{n_{e} v}\]$](/articles/aa/full_html/2025/08/aa54332-25/aa54332-25-eq15.png) to determine this term, which comes from an expression similar to Eq. (3), but involves the Li-like EII cross section:
to determine this term, which comes from an expression similar to Eq. (3), but involves the Li-like EII cross section:
![Mathematical equation: $\[\frac{n_0 v_r \sigma_{H e}^{C X}}{n_e v}=\sigma_{L i}^{E I I} \frac{I_{L i}}{I_w} \frac{\sigma_w^{D E}}{\sigma_{L i}^{D E}}-\sigma_{H e}^{R R}\]$](/articles/aa/full_html/2025/08/aa54332-25/aa54332-25-eq16.png) (4)
(4)
![Mathematical equation: $\[\frac{n_0 v_r \sigma_H^{C X}}{n_e v}=\frac{n_0 v_r \sigma_{H e}^{C X}}{n_e v}\left(\frac{\sigma_H^{C X}}{\sigma_{H e}^{C X}}\right).\]$](/articles/aa/full_html/2025/08/aa54332-25/aa54332-25-eq17.png) (5)
(5)
For Eq. (4) we selected the 1s22s 2S1/2−1s23p 2P1/2,3/2 Li-like transitions (with photon energies of 1062.2 eV and 1167.6 eV), where the population of the upper level was dominated by direct excitation either from the ground state or from radiative cascades from states that are directly excited from the ground state, and the He-like w line (6700.4 eV) that has the same upper level population properties. When determining the ![Mathematical equation: $\[\frac{n_{0} v_{r} \sigma_{H e}^{C X}}{n_{e} v}\]$](/articles/aa/full_html/2025/08/aa54332-25/aa54332-25-eq18.png) factor from Eq. (4), we used the non-Maxwellian collisional-radiative model NOMAD (Ralchenko & Maron 2001), with EII, EIE, and RR cross sections calculated by FAC (Gu 2008), to find the best match between theoretical and experimental line intensity ratios by adjusting the value of
factor from Eq. (4), we used the non-Maxwellian collisional-radiative model NOMAD (Ralchenko & Maron 2001), with EII, EIE, and RR cross sections calculated by FAC (Gu 2008), to find the best match between theoretical and experimental line intensity ratios by adjusting the value of ![Mathematical equation: $\[\frac{n_{0} v_{r} \sigma_{H e}^{C X}}{n_{e} v}\]$](/articles/aa/full_html/2025/08/aa54332-25/aa54332-25-eq19.png) .
.
The ![Mathematical equation: $\[\left(\frac{\sigma_{H}^{C X}}{\sigma_{H e}^{C X}}\right)\]$](/articles/aa/full_html/2025/08/aa54332-25/aa54332-25-eq20.png) ratio in Eq. (5) can be determined based on considerations of the charge exchange process in highly charged ions, which can dramatically shift the ionization balance toward lower charge states (Ralchenko et al. 2007). When modeling spectra in earlier work (e.g., Yang et al. 2023a; Suzuki et al. 2020), we used a linear scaling relationship of the CX cross section with the charge qi of the ion (Phaneuf 1983; Janev & Winter 1985; Otranto et al. 2006):
ratio in Eq. (5) can be determined based on considerations of the charge exchange process in highly charged ions, which can dramatically shift the ionization balance toward lower charge states (Ralchenko et al. 2007). When modeling spectra in earlier work (e.g., Yang et al. 2023a; Suzuki et al. 2020), we used a linear scaling relationship of the CX cross section with the charge qi of the ion (Phaneuf 1983; Janev & Winter 1985; Otranto et al. 2006):
![Mathematical equation: $\[\sigma_i^{C X}=q_i \cdot 10^{-15} \mathrm{~cm}^2.\]$](/articles/aa/full_html/2025/08/aa54332-25/aa54332-25-eq21.png) (6)
(6)
In the absence of measured CX cross sections, this scaling provides a reasonable approximation of interactions between highly charged ions and neutrals in the trap, based on trends observed in classical trajectory Monte Carlo (CTMC) calculations (Otranto et al. 2006). The ion charges considered in this analysis range narrowly from Fe XXV to Fe XXVII, supporting the applicability of the linear dependence described by Eq. (6).
To further confirm the linear qi dependence of Eq. (6) for the current measurement, we performed CTMC simulations, similar to those described by Otranto et al. (2006), to determine the CX cross sections between several electron charge states of iron and neutral N2 molecules. The calculations confirmed the general linear dependence of the cross section and allowed us to estimate the contribution of non-linearity to the uncertainty in the term ![Mathematical equation: $\[\frac{n_{0} v_{r} \sigma_{H}^{C X}}{n_{e} v}\]$](/articles/aa/full_html/2025/08/aa54332-25/aa54332-25-eq22.png) in Eqs. (5) and (3). This contribution is approximately 3%, which is considerably smaller than the other uncertainties involved in determining
in Eqs. (5) and (3). This contribution is approximately 3%, which is considerably smaller than the other uncertainties involved in determining ![Mathematical equation: $\[\frac{n_{0} v_{0} \sigma_{H}^{C X}}{n_{e} v}\]$](/articles/aa/full_html/2025/08/aa54332-25/aa54332-25-eq23.png) .
.
Charge exchange between neutral atoms and He-like Fe ions led to the preferential population of the electron shell with a principal quantum number n ≈ 11 being the initial capture site of the electron (where n ≈ q3/4, with q being the ion charge, according to Janev et al. 2012 and Ralchenko et al. 2008). We tested three different models to distribute the electrons across the (n, l) levels to study the effect of cascade feeding of the levels that are involved in the analysis: direct capture to the ground state, statistical population of the n = 11 states, and l population based on CTMC modeling. All three models yielded the same ![Mathematical equation: $\[\frac{n_{0} v_{r} \sigma_{H}^{C X}}{n_{e} v}\]$](/articles/aa/full_html/2025/08/aa54332-25/aa54332-25-eq24.png) factor within the experimental uncertainty limits, giving us confidence in our method for determining the ionization cross section.
factor within the experimental uncertainty limits, giving us confidence in our method for determining the ionization cross section.
The uncertainty of ![Mathematical equation: $\[\frac{n_{0} v_{r} \sigma_{H}^{C X}}{n_{e} v}\]$](/articles/aa/full_html/2025/08/aa54332-25/aa54332-25-eq25.png) is dominated by statistical uncertainty and the uncertainty due to the quantum efficiency of the spectrometer, with the overall relative uncertainty of the term amounting to 9%. This assessment is important because the charge exchange term is three to fourteen times larger than the RR term in Eq. (3) depending on the electron beam energy. Further details on the determination of the
is dominated by statistical uncertainty and the uncertainty due to the quantum efficiency of the spectrometer, with the overall relative uncertainty of the term amounting to 9%. This assessment is important because the charge exchange term is three to fourteen times larger than the RR term in Eq. (3) depending on the electron beam energy. Further details on the determination of the ![Mathematical equation: $\[\frac{n_{0} v_{r} \sigma_{H}^{C X}}{n_{e} v}\]$](/articles/aa/full_html/2025/08/aa54332-25/aa54332-25-eq26.png) factor in Eq. (3) can be found in Yang (2023) and Yang et al. (2025).
factor in Eq. (3) can be found in Yang (2023) and Yang et al. (2025).
6 Results
Measurements were conducted at five nominal electron beam energies: 9.21 keV, 9.50 keV, 10.00 keV, 12.00 keV, and 18.00 keV. The space-charge potential due to the electron beam (Currell & Fussmann 2005; Porto et al. 2000) and the neutralization by the trapped ions (Plumlee 1957; Porto et al. 2000, Hosier et al. 2023) require a correction to these beam energies. We reported the determination of these corrections and their uncertainties (Yang et al. 2023b). With these corrections, the electron beam energies at which the measurements were taken are: 9.10 ± 0.01 keV, 9.39 ± 0.01 keV, 9.89 ± 0.01 keV, 11.90 ± 0.01 keV, and 17.92 ± 0.01 keV.
The measured EII cross sections at the corrected beam energies and associated uncertainties are plotted in Fig. 2 and included in Table 2, along with the total uncertainty and component contributions to the total uncertainty. Two independent determinations of the ionization cross section were based on the corrected line intensity ratio of w to the Lyα1 lines and based on the corrected line intensity ratio of w to the Lyα2 lines.
The final reported EII cross sections are the weighted averages of the two determinations. Uncertainty contributions include, statistical uncertainties of the measurement, corrections for anisotropic line emission, population due to cascades, and quantum efficiency, theoretical uncertainties for EIE and RR cross sections, and the uncertainties associated with the combined EBIT and CX parameter. Correlations exist between some of these terms (e.g., cross-section uncertainties contribute to the uncertainty of the CX term); however, when reporting the total uncertainty, we took the conservative limit, treating the parameters as independent.
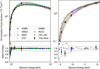 |
Fig. 2 Top-left: experimental cross sections from this work (black), along with theoretical calculations (see Sect. 7.1 for descriptions) and fits to them using Eq. (2) of Urdampilleta et al. (2017, solid lines). Bottom-left: ratios of the cross sections returned by the fitted curve to the calculated data points. The 1σ uncertainties on the experimental results are shown as dotted lines. Right: same but zoomed in on the low-energy region. |
EII cross section of Fe XXV and associated uncertainties.
7 Discussion
7.1 Comparison with theoretical calculations
In earlier calculations, Lotz introduced empirical scaling laws to predict EII cross sections (Lotz 1967, 1968) that are widely used for analyses that require quick numerical results. Younger has calculated EII cross sections for highly charged iron (Fe XVII to Fe XXVI) using the distorted wave exchange approximation (DWEA; Younger 1982). While cross sections for ejection of a 1 s electron were not included in that work, the estimation of the EII ionization of He-like iron was obtained from extrapolations of previous calculations for He-like ions (Younger 1981). Fang et al. (1995) calculated the EII cross sections for He-like isoelectronic sequence ions using a distorted-wave Born exchange approximation (DWBE) method including relativistic corrections.
Moores & Reed (1995) included the Møller interaction in RDW calculations of EII cross section for He-like ions and found a good agreement with experimental results from EBIT measurements. Concurrently, Fontes et al. (1995) also demonstrated good agreement between RDW calculations and EBIT data, but using the generalized Breit interaction instead of the Møller interaction. The results of the two groups served to demonstrate gauge invariance for the lowest-order QED correction to the Coulomb interaction. Subsequently, Fontes et al. (1999) and Sampson et al. (2009) further developed the approach for the calculation of the 1s ionization cross sections using the RDW method and investigated the effect of QED corrections to the Coulomb interaction on the ionization cross section. Both Moores and Reed and Fontes et al. focused on examining the effect of first-order QED contributions (the Breit or Møller interaction) and exchange terms in RDW calculations. Notably, both groups concluded that the inclusion of exchange terms is crucial. Furthermore, they found that substituting the static Coulomb interaction with the Møller interaction leads to a substantial increase in the ionization cross section at higher electron energies (Marrs et al. 1997).
The most relevant calculations for the present work have been reported in Fursa et al. (2016). The EII cross sections for the He-like iron ions have been calculated using convergent close-coupling (CCC) and distorted-wave methods in the relativistic and non-relativistic formulations (Fursa et al. 2016). In particular, the RDW calculations referenced in Fursa et al. (2016) build upon the methods developed by Fontes et al. (1999) and Sampson et al. (2009). Additionally, the relativistic formulation of the CCC method (RCCC) includes the QED corrections (Breit and Møller interactions) to the Coulomb potential (Bostock et al. 2009). These are the DWBA, RDW, CCC, and RCCC curves shown in Figs. 2 and 3.
Our measured experimental values are in good general agreement with the predictions of the RCCC (Fursa et al. 2016; Fursa & Bray 2008): the calculated values all fall within the error bars of the experimental results, apart from the 18 keV data point, which is 2σ − 3σ above the theoretical calculations. At low beam energies (9 keV to 12 keV), measurement results are systematically lower than most theoretical predictions and agree well with the RCCC calculations. As seen in Fig. 2, relativistic and nonrelativistic calculations diverge at higher beam energies (above 15 keV). Additional measurements at high beam energies would be desirable to confirm the relativistic trend.
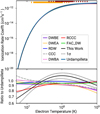 |
Fig. 3 Top: ionization rate coefficients from fits to our experiments and theoretical data (see Fig. 2). Horizontal orange and brown lines indicate temperature ranges where Fe XXV and Fe XXVI exceed 10% (dotted) and 30% (solid) of the ion fraction in equilibrium. Bottom: ratio of ionization rate coefficients to the recommended values of Urdampilleta et al. (2017), showing agreement and deviations across models: DWBE (purple), DWEA (orange), RDW (blue), CCC (gray dash-dot), RCCC (red), FAC distorted wave (green), DWBA (dashed pink), present experimental work (solid black), and its 1σ uncertainty band (dotted black). |
7.2 Converting cross sections to rate coefficients
For many practical applications, Maxwellian-averaged ionization rate coefficients, S (T), are preferred over the ionization cross sections. We therefore converted our experimental cross sections into S; however, the five experimental data points do not provide sufficient information to fully construct Maxwellian-averaged collision strengths. To compensate for this, we used Eq. (2) of Urdampilleta et al. (2017):
![Mathematical equation: $\[\begin{aligned}u I^2 \sigma(E)= & A\left(1-\frac{1}{u}\right)+B\left(1-\frac{1}{u}\right)^2, \\& +C R ~\ln~ u+D \frac{\ln~ u}{\sqrt{u}}+F \frac{\ln~ u}{u}\end{aligned}\]$](/articles/aa/full_html/2025/08/aa54332-25/aa54332-25-eq27.png) (7)
(7)
where I is the ionization energy, 8.828 keV, C is the Bethe constant, u = E/I, the incident electron energy in threshold units, R is a relativistic correction (R ≈ 1 + 1.5ϵ + 0.25ϵ2, where ϵ = E/mc2), and σ is the ionization cross section. This is similar to the formula of Younger (1982), but with the extra term ![Mathematical equation: $\[D \frac{\ln u}{\sqrt{u}}\]$](/articles/aa/full_html/2025/08/aa54332-25/aa54332-25-eq28.png) , and the relativistic correction. As the Bethe constant is taken to be for Fe XXV, C = 3.8 × 10⁻¹⁴ cm2 eV2), based on the scaling prescription of Younger (1982), who derived the Bethe coefficients from extensive photoionization cross-section tabulations of Manson, this leaves the fit coefficients A, B, D, and F to be obtained from the experimental results.
, and the relativistic correction. As the Bethe constant is taken to be for Fe XXV, C = 3.8 × 10⁻¹⁴ cm2 eV2), based on the scaling prescription of Younger (1982), who derived the Bethe coefficients from extensive photoionization cross-section tabulations of Manson, this leaves the fit coefficients A, B, D, and F to be obtained from the experimental results.
As shown in Fig. 2, we applied this formula to both the theoretical and experimental data, with the fit shown by the solid lines and the differences between the fit and data points in the lower panel. In general, the datasets are well represented by the fitted data, with discrepancies above 10% for the experiment and the RCCC data around 9.5 keV as the main outliers. As our experimental data are all at low energies (E < 20 keV), in order to constrain the high energy behavior of the cross sections we added two extra data points at u = 6 and u = 20, with σ = 3.87 × 10⁻²² cm2 and 1.73 × 10⁻²² cm2, taken from the results of Zhang & Sampson (1990) and fits to that data by Urdampilleta et al. (2017), respectively. The coefficient values for the best fit curve are: I = 8.8282 keV, A = −31.4 × 10⁻¹⁴ cm2 eV2, B = 25.3 × 10⁻¹⁴ cm2 eV2, C = 3.80 × 10⁻¹⁴ cm2 eV2, D = 21.6 × 10⁻¹⁴ cm2 eV2, and F = 10.3 × 10⁻¹⁴ cm2 eV2, where I and C are fixed.
To provide meaningful uncertainties on the resulting rate coefficients, the uncertainties on the experimental cross sections were assumed to be normally distributed with the experimental errors representing ±1σ distribution. We assumed a ±10% error on the two added high energy data points, consistent with that of the measured cross sections. For each experimental point, 1000 normally distributed values were created, and then fits to Eq. (7) were created for each of these 1000 different datasets to produce 1000 sets of fit coefficients. To obtain the uncertainties shown on Fig. 2, these were evaluated at each of 1001 energies between 106.4 K and 109 K, and the 154th and 856th largest cross section at each energy gives the ±1σ limit shown. The same process was repeated for the rate coefficients shown in Fig. 3. This method was chosen to avoid artifacts from fitting the upper and lower 1σ data points alone, where the curves would overlap at certain energies implying a zero uncertainty.
Figure 2 shows the results of these fits over a large range of energies; the left shows the full range from threshold to 100 keV, the right focuses on the threshold region. The fitted data agree with the theoretical and experimental data points to within 3% for above 10 keV, below this there are some larger outliers, though the fit remains within about 17% of the data at all energies. The importance of the 18 keV data in shaping the entire fit is clearly apparent, it is therefore also clear that further data around and above this energy could improve these results significantly.
We converted the parameters obtained from the fits to the cross-section data to ionization rate coefficients, S, using the procedure described in Appendix B of Urdampilleta et al. (2017). The results of this are compared to the coefficients from Urdampilleta et al. (2017), which are themselves fits to the data of Zhang & Sampson (1990), in Fig. 3. The comparisons in the bottom panel once again show the divergence of the relativistic and nonrelativistic methods at high temperatures. They also show the significant increase in S for the experimental data at around T = 108 K, which is driven by the E = 18 keV data, while at low temperature the RCCC and experimental data both show a decrease similar to the low energy behavior observed in the cross sections.
To estimate the impact of these rates on the observed spectra, we show in Fig. 4 the ionization fraction of Fe XXV and Fe XXVI for a collisionally ionized plasma in equilibrium using our results, and the ±1σ limits. The abundance of Fe XXV is largely unchanged below T = 4 × 10⁷ K, while at higher temperatures a modest reduction is implied of around 10% compared with previous calculations. However, at T = 108 K, Fe XXV still forms 20% of the iron in the plasma; therefore, this change will have an effect on line ratios when comparing Fe Heα to Lyα emission. Meanwhile Fe XXVI abundances are essentially unchanged (agree within 5% of previous work) above 4 × 10⁷ K, and below that the ion is not a strong contributor to the spectrum in this range.
At the highest temperatures, the rate coefficients are most affected by the higher energy cross sections, which were in the case of our data obtained by fixed high energy points as opposed to experimental data. This raises the question of how much of our results are due to the new cross-section measurements, and how much is due to the extrapolation to high energy. Figure 5 shows the fractional contribution to S (T) for electrons with energies above 18, 20, 25, 30, 40, and 50 keV.
While our highest energy experimental point is at 18 keV, it strongly influences the fitted rates up to at least E = 25 keV. These electrons contribute more than 50% of S(T) up to T ≈ 200 MK.
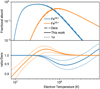 |
Fig. 4 Ionization fraction of Fe XXV (blue) and Fe XXVI (orange) in collisional ionization equilibrium at low electron density (Ne = 1 cm−3). Solid lines (with ±1σ dotted) represent this work; dash-dotted lines use the ionization and recombination rates from Bryans et al. (2009), which include RDW rates from Fontes et al. (1999). Bottom panel: ratio of this work to the Bryans et al. (2009) results (dash-dotted to solid lines). |
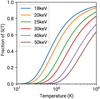 |
Fig. 5 Fraction of the ionization rate coefficient contributed by σ(E), where E > Elegend. |
8 Conclusions
We report the measurement of the EII cross section of He-like Fe XXV at several electron beam energies. The cross section ranges from 2.0 × 10⁻²³ cm2 at 9.1 keV electron energy to 4.3 × 10⁻²² cm2 at 17.92 keV. The analysis allowed the determination of uncertainty contributions from various sources: the statistical uncertainty of the measured Li-like, He-like, and H-like line intensities dominate the error budget.
The measured cross sections are in good agreement with RCCC calculations (Fursa et al. 2016; Fursa & Bray 2008) at low beam energies. In contrast, theoretical predictions based on nonrelativistic and perturbative calculations, commonly used in astrophysical spectra analysis, are higher than the measured values, particularly near the ionization threshold. Converting these measured cross sections into rate coefficients allowed us to probe the effect of the measured cross-section values and their uncertainties on ionization balance predictions in astrophysical plasmas, revealing a discrepancy in the calculated abundance of Fe XXV and Fe XXVI of up to 10% compared with the widely used dataset of Bryans et al. (2009).
We note that these changes are largely driven by a single ionization cross-section measurement at E = 18 keV, which is larger than the observed rates and strongly influences the fits. Future measurements around and above 18 keV would help improve the reliability of these results.
Data availability
The experimental EII cross sections of Fe XXV presented in Table 2 are available at Zenodo: https://doi.org/10.5281/zenodo.16011756.
Acknowledgements
This work was funded by the NASA Grant Award Number 80NSSC18K0234, NIST Grant Award Numbers 70NANB19H024, and by the National Science Foundation Award Number 1806494. The authors would like to thank D. Fursa for providing numerical data and useful discussions.
References
- Aharonian, F., Akamatsu, H., Akimoto, F., et al. 2016, Nature, 535, 117 [CrossRef] [Google Scholar]
- Artemyev, A., Shabaev, V., Yerokhin, V., Plunien, G., & Soff, G. 2005, Phys. Rev. A, 71, 062104 [Google Scholar]
- Beiersdorfer, P. 2003, Annu. Rev. Astron. Astrophys., 41, 343 [Google Scholar]
- Beiersdorfer, P., Graf, A., Harris, C., Hwang, D., & Neill, P. 2002, Lifetime of the 1s2p 1P1 Excited Level in Fe24+, Tech. rep., Lawrence Livermore National Lab. (LLNL), Livermore, CA (United States) [Google Scholar]
- Bostock, C. J., Fursa, D. V., & Bray, I. 2009, Phys. Rev. A, 80, 052708 [Google Scholar]
- Brickhouse, N. S., & Drake, J. J. 2000, in Rev. Mex. Astron. Astrofis. Conf. Ser., 9, 24 [Google Scholar]
- Bryans, P., Landi, E., & Savin, D. W. 2009, ApJ, 691, 1540 [CrossRef] [Google Scholar]
- Chantrenne, S., Beiersdorfer, P., Cauble, R., & Schneider, M. 1992, Phys. Rev. Lett., 69, 265 [Google Scholar]
- Currell, F., & Fussmann, G. 2005, IEEE Trans. Plasma Sci., 33, 1763 [Google Scholar]
- Dipti, Buechele, S. W., Gall, A. C., et al. 2020, J. Phys. B, 53, 115701 [Google Scholar]
- Ezoe, Y., Ohashi, T., & Mitsuda, K. 2021, Rev. Mod. Plasma Phys., 5, 1 [NASA ADS] [CrossRef] [Google Scholar]
- Fang, D., Hu, W., Chen, C., et al. 1995, At. Data Nucl. Data Tables, 61, 91 [Google Scholar]
- Fontes, C. J., Sampson, D. H., & Zhang, H. L. 1995, Phys. Rev. A, 51, R12 [Google Scholar]
- Fontes, C. J., Sampson, D. H., & Zhang, H. L. 1999, Phys. Rev. A, 59, 1329 [Google Scholar]
- Foster, A. R., Ji, L., Smith, R. K., & Brickhouse, N. S. 2012, ApJ, 756, 128 [Google Scholar]
- Fursa, D. V., & Bray, I. 2008, Phys. Rev. Lett., 100, 113201 [Google Scholar]
- Fursa, D. V., Bostock, C. J., Bray, I., & Fontes, C. J. 2016, J. Phys. B, 49, 184001 [Google Scholar]
- Gall, A. C., Foster, A. R., Silwal, R., et al. 2019, ApJ, 872, 194 [Google Scholar]
- Gall, A., Dipti, Buechele, S. W., et al. 2020, J. Phys. B, 53, 145004 [Google Scholar]
- Gillaspy, J. D. 1996, Phys. Scr., T65, 168 [Google Scholar]
- Gillaspy, J. D. 1997, Phys. Scr., T71, 99 [Google Scholar]
- Gillaspy, J. D., Schneider, M. B., Bernitt, S., Brown, G. V., & Beiersdorfer, P. 1997, Phys. Scr., T71, 99 [Google Scholar]
- Gregory, D., Wang, L., Swenson, D., Sataka, M., & Chantrenne, S. 1990, Phys. Rev. A, 41, 6512 [Google Scholar]
- Gu, M. F. 2008, Can. J. Phys., 86, 675 [NASA ADS] [CrossRef] [Google Scholar]
- Herrmann, G. 1958, J. Appl. Phys., 29, 127 [Google Scholar]
- Heuer, K., Foster, A. R., & Smith, R. 2021, ApJ, 908, 3 [NASA ADS] [CrossRef] [Google Scholar]
- Hitomi Collaboration (Aharonian, F., et al.) 2018a, Publ. Astron. Soc. Jpn., 70, 9 [Google Scholar]
- Hitomi Collaboration (Aharonian, F., et al.) 2018b, Publ. Astron. Soc. Jpn., 70, 12 [Google Scholar]
- Hitomi Collaboration (Aharonian, F., et al.) 2018c, Publ. Astron. Soc. Jpn., 70, 10 [Google Scholar]
- Holland, G. E., Boyer, C. N., Seely, J. F., et al. 2005, Rev. Sci. Instrum., 76, 073304 [Google Scholar]
- Hosier, A., Dipti, Yang, Y., et al. 2023, Atoms, 11, 48 [Google Scholar]
- Huenemoerder, D. P., Schulz, N. S., Testa, P., et al. 2010, ApJ, 723, 1558 [Google Scholar]
- Janev, R. K., & Winter, H. 1985, Phys. Rep., 117, 265 [Google Scholar]
- Janev, R. K., Presnyakov, L. P., & Shevelko, V. P. 2012, Physics of Highly Charged Ions (Springer Science & Business Media) [Google Scholar]
- Kallman, T., & Palmeri, P. 2007, Rev. Mod. Phys., 79, 79 [NASA ADS] [CrossRef] [Google Scholar]
- Kramida, A., Ralchenko Yu, Reader, J., & NIST ASD Team (2024). 2024, NIST Atomic Spectra Database (ver. 5.12) [Online]. Available: https://physics.nist.gov/asd [Google Scholar]
- Levine, M. A., Marrs, R., Henderson, J., Knapp, D., & Schneider, M. B. 1988, Phys. Scr., 1988, 157 [Google Scholar]
- Linkemann, J., Müller, A., Kenntner, J., et al. 1995, Phys. Rev. Lett., 74, 4173 [Google Scholar]
- Lotz, W. 1967, ApJS, 14, 207 [Google Scholar]
- Lotz, W. 1968, Z. Phys., 216, 241 [NASA ADS] [CrossRef] [Google Scholar]
- Marrs, R., Elliott, S., & Scofield, J. 1997, Phys. Rev. A, 56, 1338 [Google Scholar]
- Mendoza, C., Bautista, M. A., Deprince, J., et al. 2021, Atoms, 9, 12 [CrossRef] [Google Scholar]
- Moores, D., & Reed, K. 1995, Phys. Rev. A, 51, R9 [Google Scholar]
- Nandra, K. 2006, MNRAS, 368, L62 [NASA ADS] [CrossRef] [Google Scholar]
- Otranto, S., Olson, R. E., & Beiersdorfer, P. 2006, Phys. Rev. A, 73, 022723 [Google Scholar]
- Paerels, F. B., & Kahn, S. M. 2003, Annu. Rev. Astron. Astrophys., 41, 291 [Google Scholar]
- Parpia, F., & Johnson, W. 1982, Phys. Rev. A, 26, 1142 [NASA ADS] [CrossRef] [Google Scholar]
- Penetrante, B., Bardsley, J., DeWitt, D., Clark, M., & Schneider, D. 1991, Phys. Rev. A, 43, 4861 [Google Scholar]
- Phaneuf, R. 1983, Phys. Rev. A, 28, 1310 [Google Scholar]
- Plumlee, R. 1957, Rev. Sci. Instrum., 28, 830 [Google Scholar]
- Porto, J. V., Kink, I., & Gillaspy, J. D. 2000, Rev. Sci. Instrum., 71, 3050 [Google Scholar]
- Ralchenko, Y. V., & Maron, Y. 2001, J. Quant. Spectrosc. Radiat. Transf., 71, 609 [Google Scholar]
- Ralchenko, Y., Reader, J., Pomeroy, J. M., Tan, J. N., & Gillaspy, J. D. 2007, J. Phys. B, 40, 3861 [Google Scholar]
- Ralchenko, Y., Draganic, I., Tan, J., et al. 2008, J. Phys. B, 41, 021003 [Google Scholar]
- Rudolph, J. K., Bernitt, S., Epp, S., et al. 2013, Phys. Rev. Lett., 111, 103002 [Google Scholar]
- Saloman, E., Hubbell, J., & Scofield, J. 1988, At. Data Nucl. Data Tables, 38, 1 [Google Scholar]
- Sampson, D. H., Zhang, H. L., & Fontes, C. J. 2009, Phys. Rep., 477, 111 [Google Scholar]
- Sanders, J. S., & Fabian, A. C. 2006, MNRAS, 370, 63 [NASA ADS] [CrossRef] [Google Scholar]
- Sapirstein, J., Cheng, K., et al. 2011, Phys. Rev. A, 83, 012504 [Google Scholar]
- Stella, L., & Campana, S. 1991, Iron Line Diagnostics in X-ray Sources, eds. A. Treves, G. C. Perola, & L. Stella [Google Scholar]
- Stenke, M., Hartenfeller, U., Aichele, K., et al. 1999, J. Phys. B, 32, 3641 [Google Scholar]
- Suryanarayanan, A., Paerels, F., & Leutenegger, M. 2024, ApJ, 969, 110 [Google Scholar]
- Suzuki, C., Yang, Y., Gall, A., et al. 2020, J. Phys. B, 54, 015001 [Google Scholar]
- Szypryt, P., O’Neil, G. C., Takacs, E., et al. 2019, Rev. Sci. Instrum., 90, 123107 [Google Scholar]
- Takahashi, T., Kokubun, M., Mitsuda, K., et al. 2016, in Space Telescopes and Instrumentation 2016: Ultraviolet to Gamma Ray, 9905, International Society for Optics and Photonics, 99050U [Google Scholar]
- Tashiro, M., Maejima, H., Toda, K., et al. 2018, in Space Telescopes and Instrumentation 2018: Ultraviolet to Gamma Ray, 10699, International Society for Optics and Photonics, 1069922 [Google Scholar]
- Urdampilleta, I., Kaastra, J. S., & Mehdipour, M. 2017, A&A, 601, A85 [NASA ADS] [CrossRef] [EDP Sciences] [Google Scholar]
- Wong, K., Beiersdorfer, P., Chen, M., et al. 1993, Phys. Rev. A, 48, 2850 [Google Scholar]
- Wong, K., Beiersdorfer, P., Reed, K., & Osterheld, A. 2002, Measurement of the Relative Intensity of the Lyα Lines in Fe25+, Tech. rep., Lawrence Livermore National Lab. (LLNL), Livermore, CA [Google Scholar]
- XRISM Collaboration 2024a, PASJ, 76, 1186 [Google Scholar]
- XRISM Collaboration 2024b, ApJ, 973, L25 [Google Scholar]
- Yamaguchi, H., Eriksen, K. A., Badenes, C., et al. 2013, ApJ, 780, 136 [NASA ADS] [CrossRef] [Google Scholar]
- Yang, Y. 2023, PhD thesis, Clemson University [Google Scholar]
- Yang, Y., Dipti, Suzuki, C., et al. 2023a, J. Phys. B, 56, 175003 [Google Scholar]
- Yang, Y., Dipti, Gall, A., et al. 2023b, Atoms, 11, 44 [Google Scholar]
- Yang, Y., Takacs, E., Dipti, et al. 2025, J. Instrum., 20, C04028 [Google Scholar]
- Younger, S. 1981, J. Quant. Spectrosc. Radiat. Transf., 26, 329 [Google Scholar]
- Younger, S. 1982, J. Quant. Spectrosc. Radiat. Transf., 27, 541 [Google Scholar]
- Zhang, H. L., & Sampson, D. H. 1990, Phys. Rev. A, 42, 5378 [Google Scholar]
All Tables
All Figures
|
Fig. 1 Experimental spectra at five nominal electron beam energies from 9.21 keV to 18.00 keV. For easier visual identification of the major components of He-like Fe XXV complexes and H-like Fe XXVI Lyα lines, the inset spectra show the same experimental spectra with the photon energy range between 6500 eV and 7050 eV. In the inset spectra of 18.00 keV, the strongest resonance He-like Fe XXV w and the H-like Fe XXVI Lyα lines are indicated. |
| In the text | |
|
Fig. 2 Top-left: experimental cross sections from this work (black), along with theoretical calculations (see Sect. 7.1 for descriptions) and fits to them using Eq. (2) of Urdampilleta et al. (2017, solid lines). Bottom-left: ratios of the cross sections returned by the fitted curve to the calculated data points. The 1σ uncertainties on the experimental results are shown as dotted lines. Right: same but zoomed in on the low-energy region. |
| In the text | |
|
Fig. 3 Top: ionization rate coefficients from fits to our experiments and theoretical data (see Fig. 2). Horizontal orange and brown lines indicate temperature ranges where Fe XXV and Fe XXVI exceed 10% (dotted) and 30% (solid) of the ion fraction in equilibrium. Bottom: ratio of ionization rate coefficients to the recommended values of Urdampilleta et al. (2017), showing agreement and deviations across models: DWBE (purple), DWEA (orange), RDW (blue), CCC (gray dash-dot), RCCC (red), FAC distorted wave (green), DWBA (dashed pink), present experimental work (solid black), and its 1σ uncertainty band (dotted black). |
| In the text | |
|
Fig. 4 Ionization fraction of Fe XXV (blue) and Fe XXVI (orange) in collisional ionization equilibrium at low electron density (Ne = 1 cm−3). Solid lines (with ±1σ dotted) represent this work; dash-dotted lines use the ionization and recombination rates from Bryans et al. (2009), which include RDW rates from Fontes et al. (1999). Bottom panel: ratio of this work to the Bryans et al. (2009) results (dash-dotted to solid lines). |
| In the text | |
|
Fig. 5 Fraction of the ionization rate coefficient contributed by σ(E), where E > Elegend. |
| In the text | |
Current usage metrics show cumulative count of Article Views (full-text article views including HTML views, PDF and ePub downloads, according to the available data) and Abstracts Views on Vision4Press platform.
Data correspond to usage on the plateform after 2015. The current usage metrics is available 48-96 hours after online publication and is updated daily on week days.
Initial download of the metrics may take a while.