Open Access
Fig. 3
Download original image
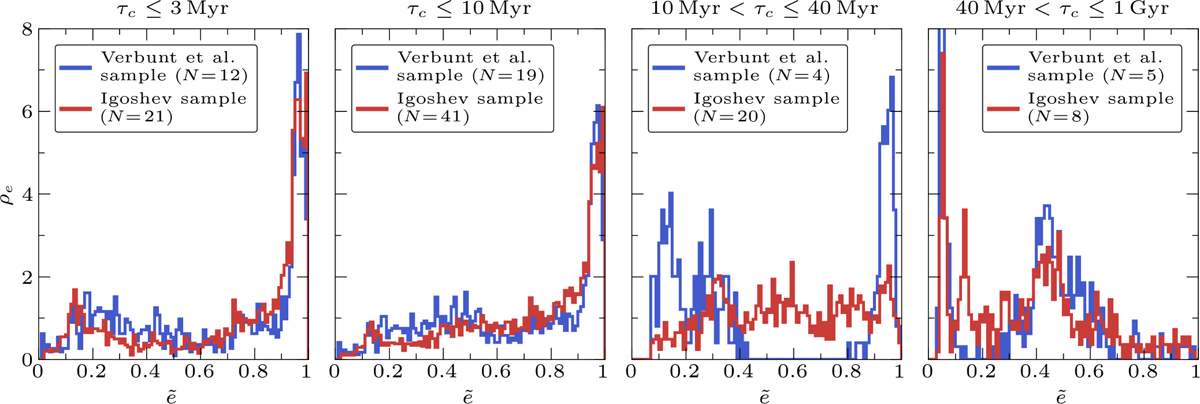
Galactic eccentricities for the pulsars in the samples of Verbunt et al. (2017, blue) and Igoshev (2020, red), as defined in Eq. (6). The distributions are shown in histograms with bins of 0.01, and divided in four ranges of τc consisting of N pulsars.
Current usage metrics show cumulative count of Article Views (full-text article views including HTML views, PDF and ePub downloads, according to the available data) and Abstracts Views on Vision4Press platform.
Data correspond to usage on the plateform after 2015. The current usage metrics is available 48-96 hours after online publication and is updated daily on week days.
Initial download of the metrics may take a while.