Fig. 4
Download original image
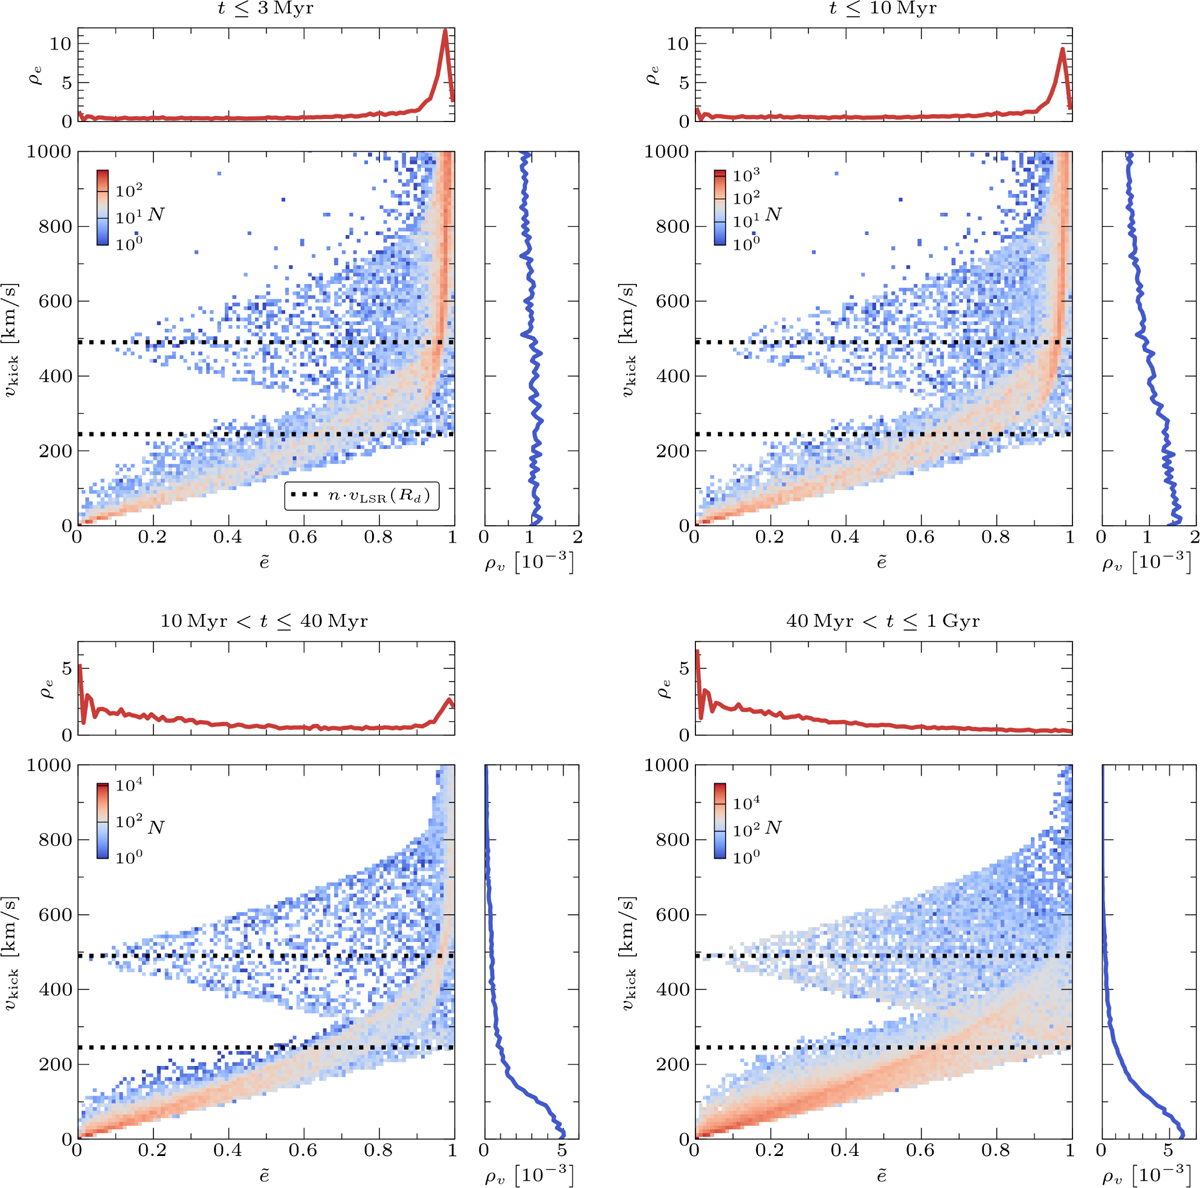
Distributions of vkick versus ẽ for objects in the solar neighbourhood (D ≤ 2 kpc) as resulting from the simulations, shown in 2D histograms on a logarithmic colour scale with eccentricity bins of 0.01 and velocity bins of 10 km/s. We show the eccentricities found in four time-bins, corresponding to the bins from Fig. 3. Each distribution also shows the integrated ẽ and vkick densities (ρe and ρv, respectively). The dotted black lines show one and two times the circular velocity at Rd = 7.04 kpc (from Eq. (7)). For the distribution of the total population see Appendix C.
Current usage metrics show cumulative count of Article Views (full-text article views including HTML views, PDF and ePub downloads, according to the available data) and Abstracts Views on Vision4Press platform.
Data correspond to usage on the plateform after 2015. The current usage metrics is available 48-96 hours after online publication and is updated daily on week days.
Initial download of the metrics may take a while.