Fig. 5
Download original image
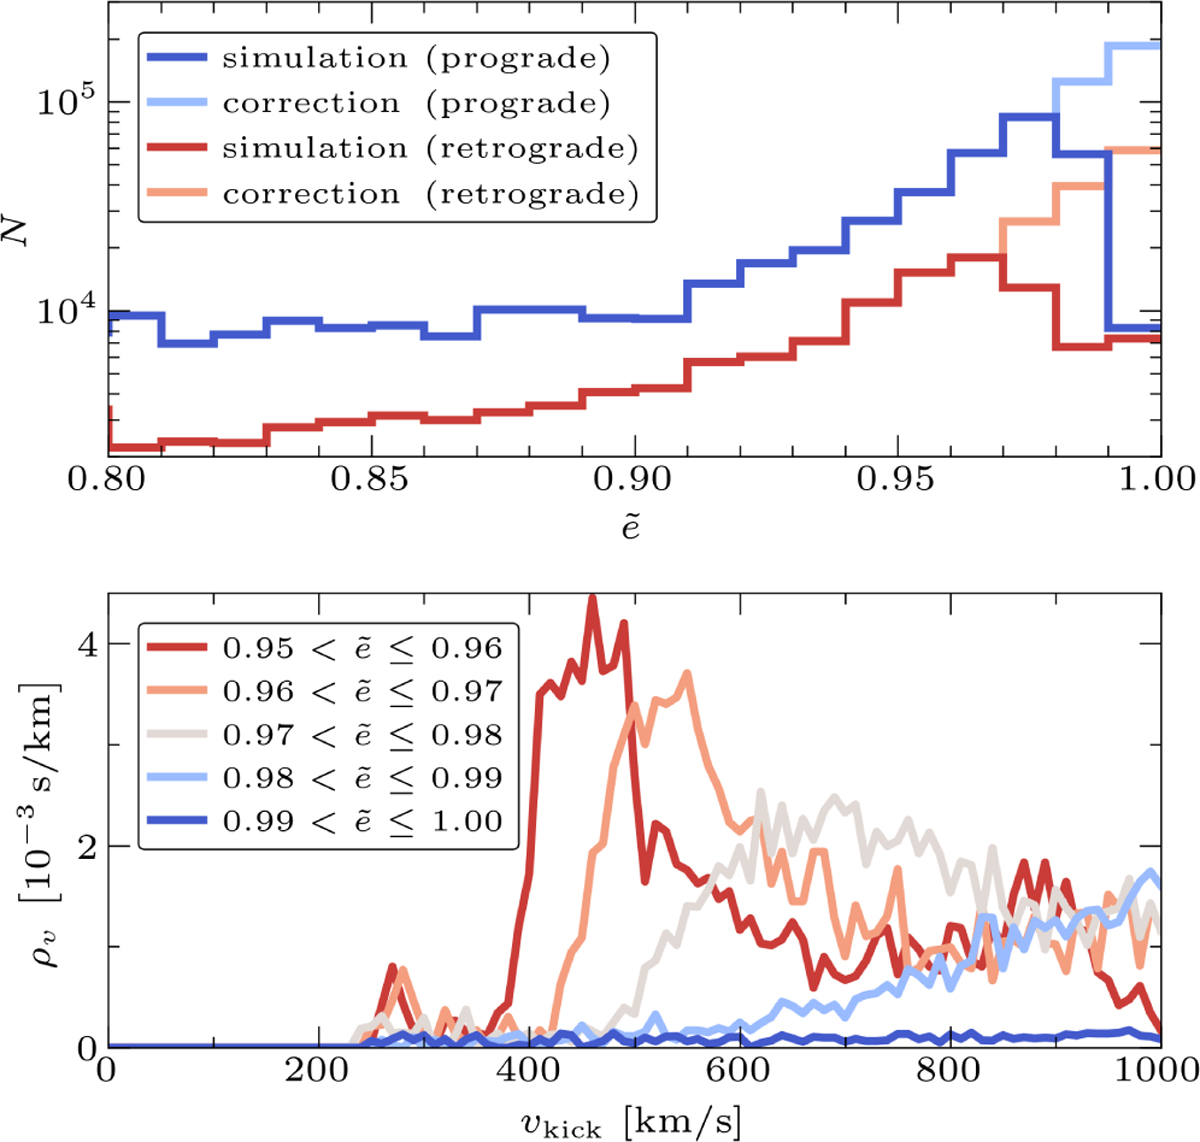
Correction made to the normalisation of the simulated vkick versus ẽ distributions of young objects (the figure shows the example of τc ≤ 10 Myr). The top panel shows the amount of objects per eccentricity bin for progrades (blue) and retrogrades (red) orbits, as well as the corrected amounts used for the normalisation (lightblue and lightred, respectively). The bottom panel shows the kick distributions for the five ẽ bins closest to 1 (indicated by colour), normalised using the corrected values shown above.
Current usage metrics show cumulative count of Article Views (full-text article views including HTML views, PDF and ePub downloads, according to the available data) and Abstracts Views on Vision4Press platform.
Data correspond to usage on the plateform after 2015. The current usage metrics is available 48-96 hours after online publication and is updated daily on week days.
Initial download of the metrics may take a while.