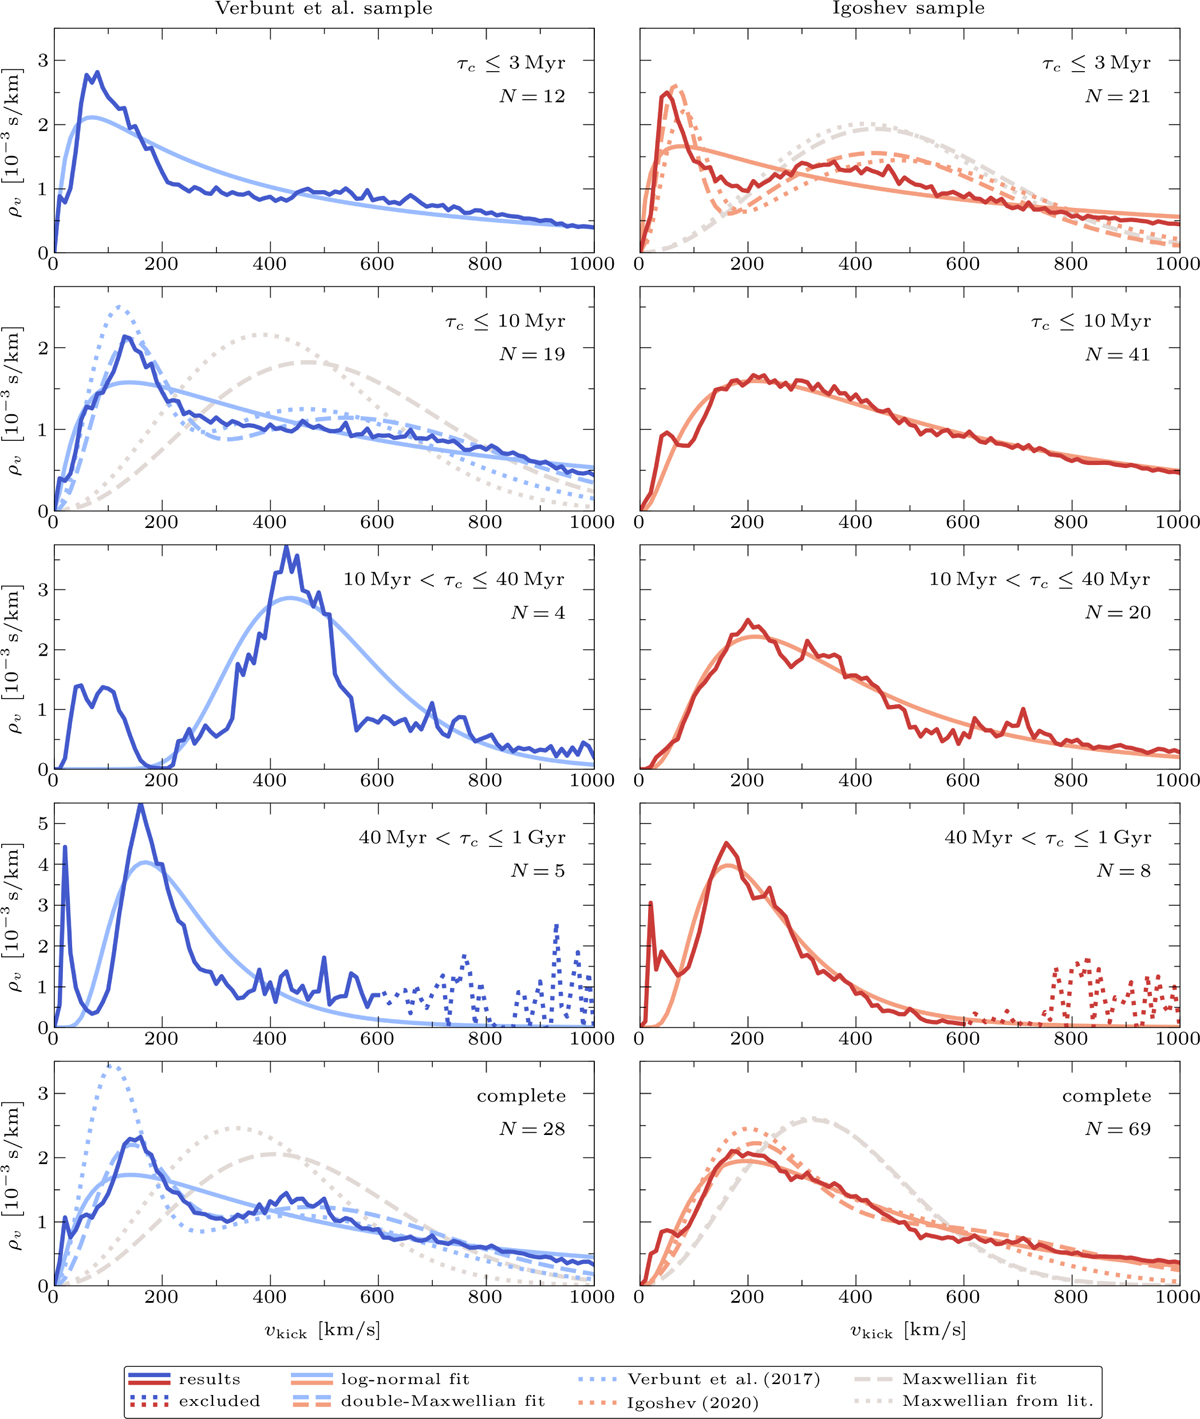
Fig. 6
Download original image
Resulting kick estimates (solid blue and red lines) for the pulsars in the sample of Verbunt et al. (2017, blue and left column) and the expanded sample of Igoshev (2020, red and right column) after applying the method described in Sect. 3 to the eccentricity estimates shown in Fig. 3. The samples - consisting of N pulsars - are divided in four age ranges (i.e. τc ≤ 3 Myr, τc ≤ 10 Myr, 10 Myr < τc ≤ 40 Myr, 40 Myr < τc ≤ 1 Gyr, and the complete sample) as shown in the different rows. We fitted log-normal distributions (solid light blue/red) to the results in each panel (listed in Table 1), and to the results corresponding to the ages analysed in the literature we also fitted Maxwellians and double-Maxwellians (dashed light blue/red and grey lines, listed in Table 2). The corresponding distributions posed by Verbunt et al. (2017) and Igoshev (2020) are also shown (dotted light blue/red and grey lines). For ages 40 Myr < τc ≤ 1 Gyr we excluded the results for vkick > 600 km/s (dotted blue/red lines) in the normalisation and fits. We adopted the log-normal fit to the results for the τc ≤ 10 Myr Igoshev sample as the fiducial natal NS kick distribution.
Current usage metrics show cumulative count of Article Views (full-text article views including HTML views, PDF and ePub downloads, according to the available data) and Abstracts Views on Vision4Press platform.
Data correspond to usage on the plateform after 2015. The current usage metrics is available 48-96 hours after online publication and is updated daily on week days.
Initial download of the metrics may take a while.