Fig. 7
Download original image
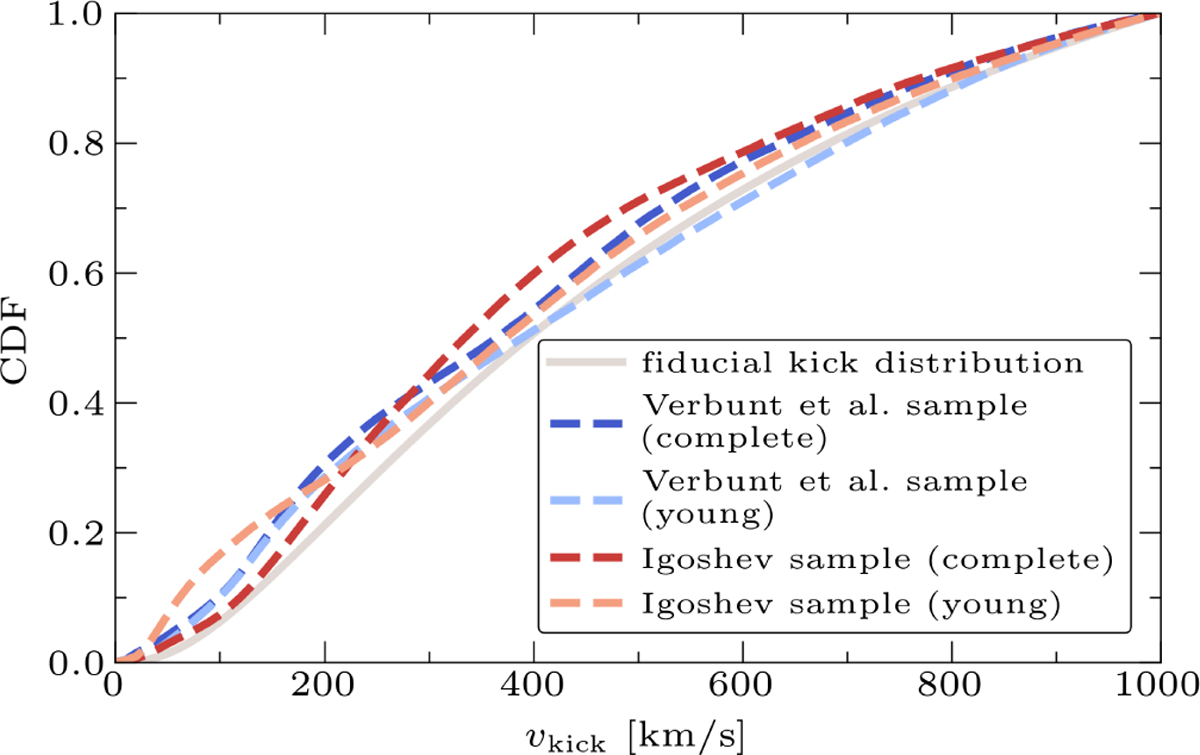
Cumulative distributions of the fiducial kick distribution (lognormal with μ = 6.00 and σ = 0.85, grey) compared to the kick distributions from Verbunt et al. (2017, blue) and Igoshev (2020, red), for their complete samples as well as young subsets (blue/red and light blue/red, respectively). The distributions are all normalised in the region of 0 km/s ≤ vkick ≤ 1000 km/s.
Current usage metrics show cumulative count of Article Views (full-text article views including HTML views, PDF and ePub downloads, according to the available data) and Abstracts Views on Vision4Press platform.
Data correspond to usage on the plateform after 2015. The current usage metrics is available 48-96 hours after online publication and is updated daily on week days.
Initial download of the metrics may take a while.