Open Access
Fig. A.1
Download original image
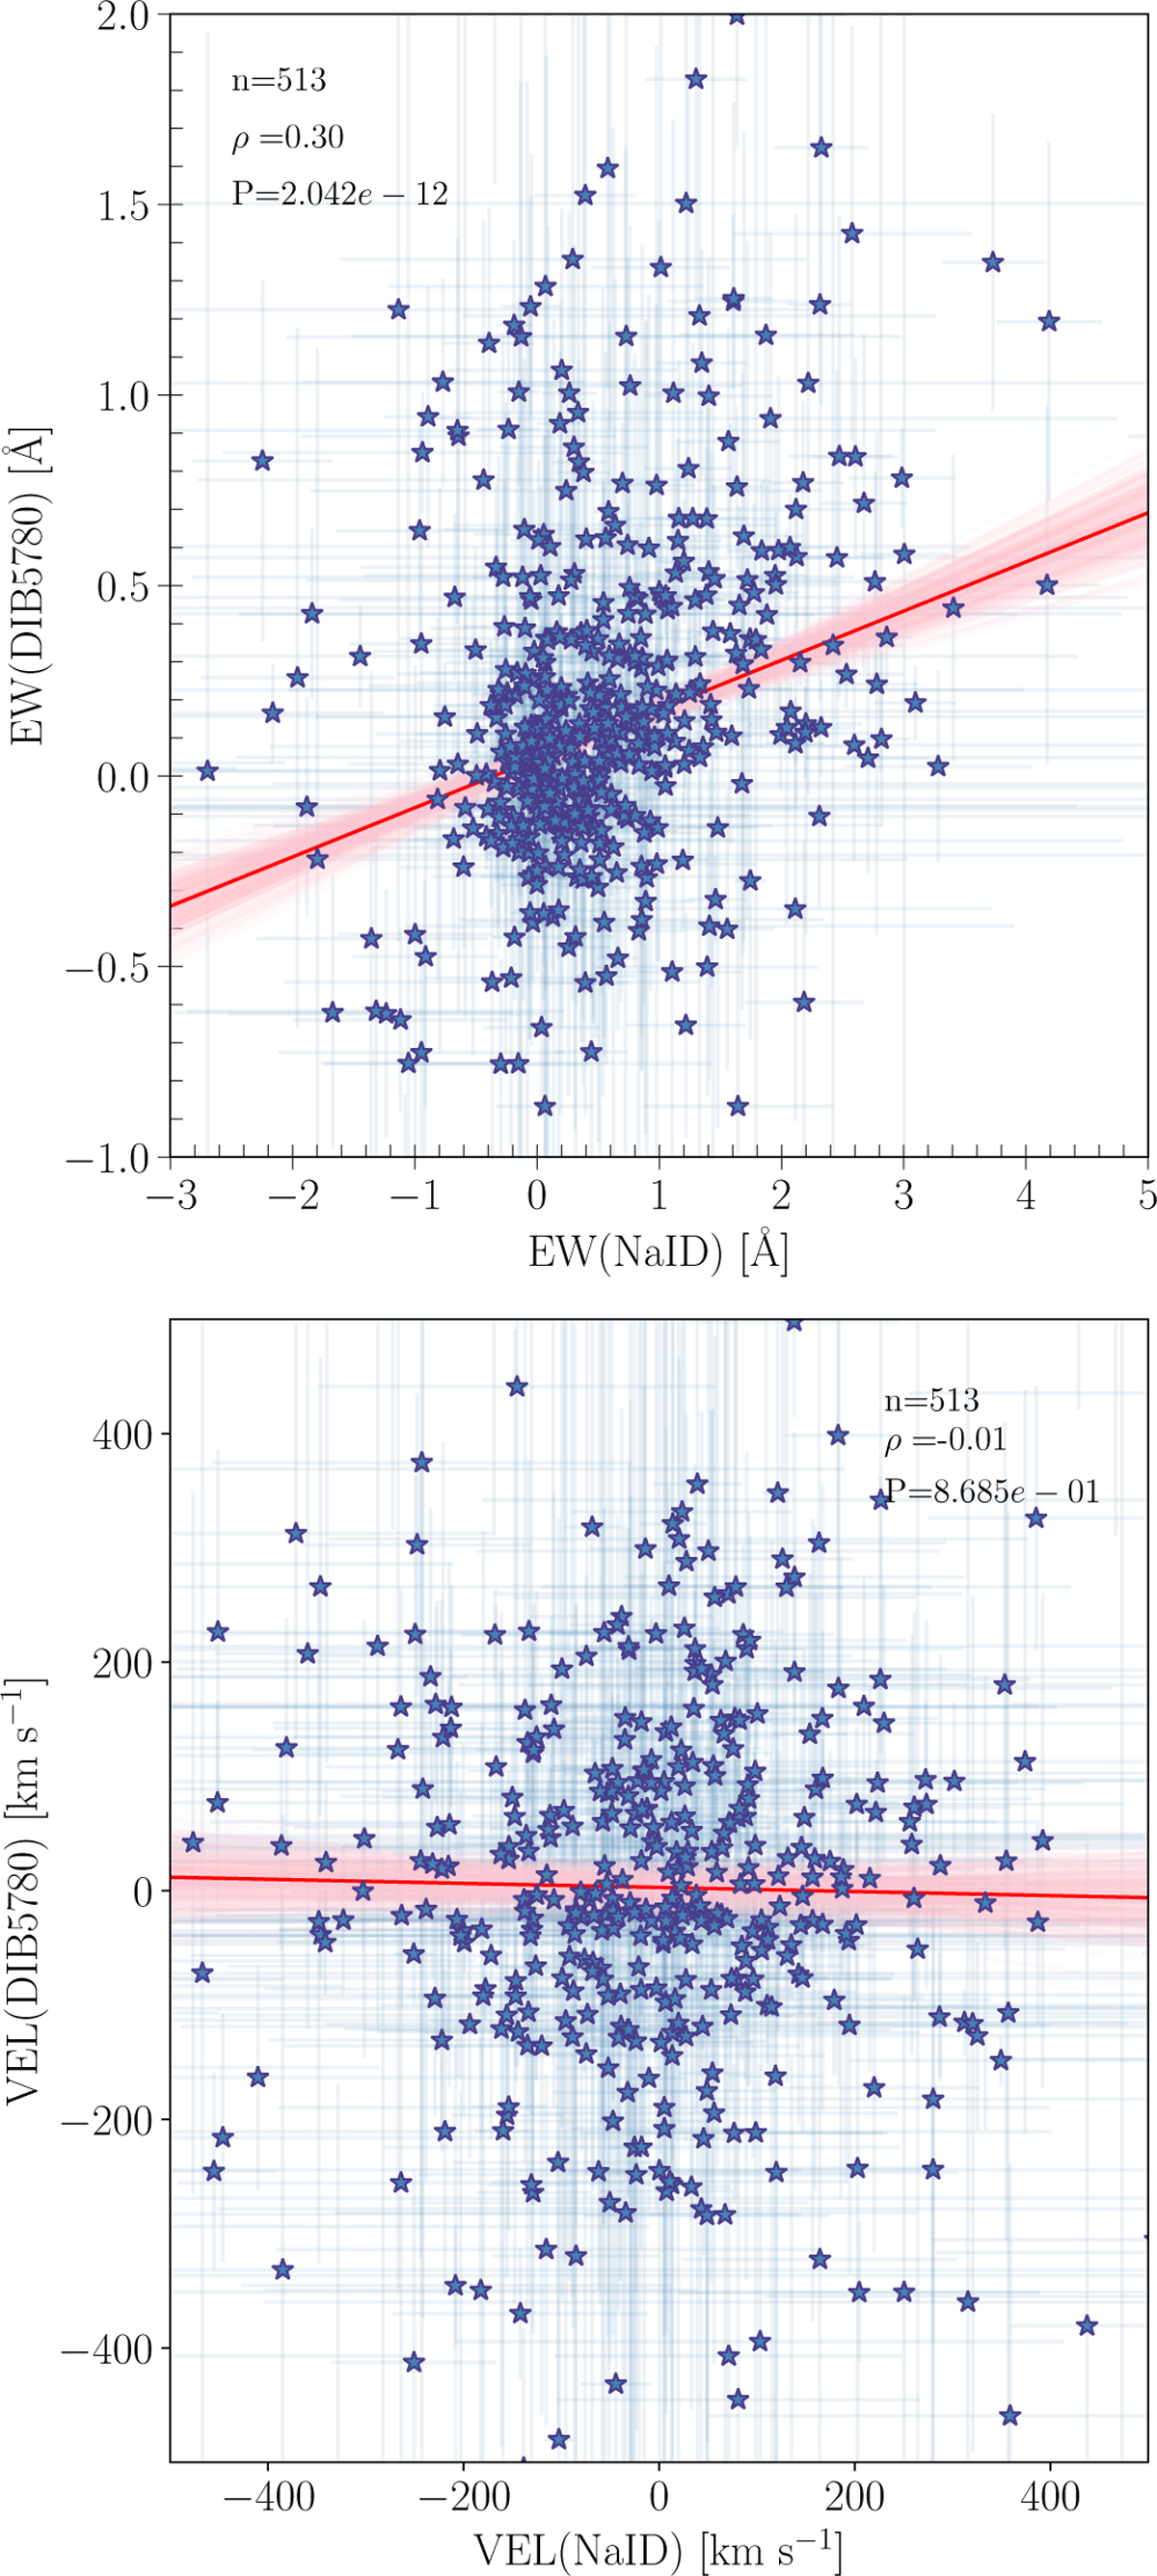
Comparison of NaI D lines with DIB-5780 for EW (top) and VEL (bottom). The median linear fit is shown in red while in pink are various realisations of the MCMC. The correlation is ρ = 0.30 for the EW and ρ = −0.01 for the VEL, while the median slope is ![]() 8.4σ above zero, for EW, and
8.4σ above zero, for EW, and ![]() for VEL, fully consistent with zero.
for VEL, fully consistent with zero.
Current usage metrics show cumulative count of Article Views (full-text article views including HTML views, PDF and ePub downloads, according to the available data) and Abstracts Views on Vision4Press platform.
Data correspond to usage on the plateform after 2015. The current usage metrics is available 48-96 hours after online publication and is updated daily on week days.
Initial download of the metrics may take a while.