Fig. 8
Download original image
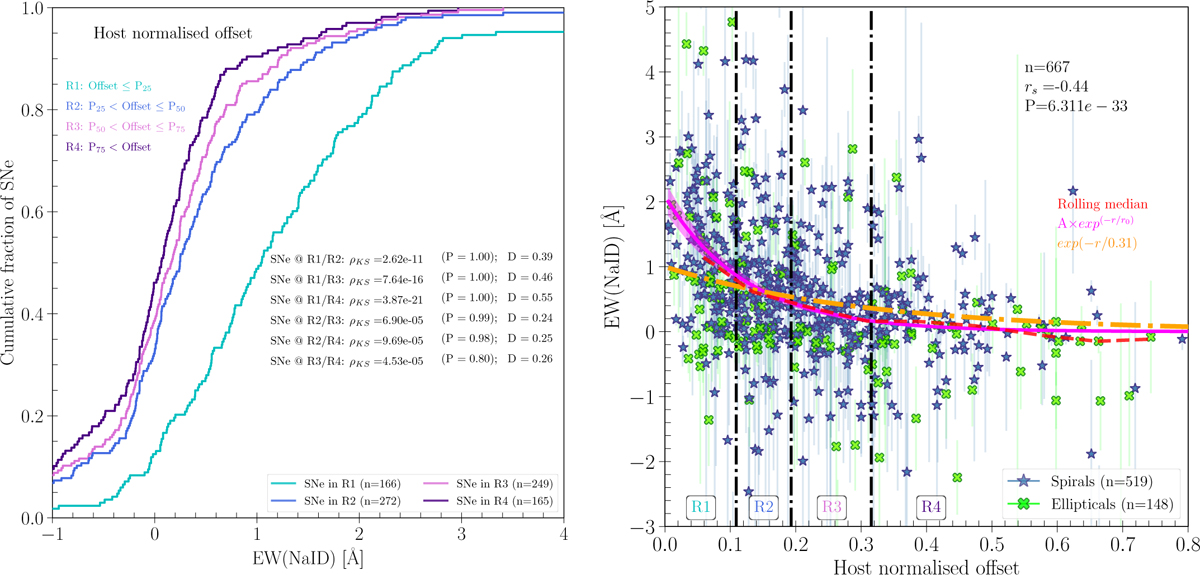
Left : cumulative distributions of NaID EW divided into four bins according to normalised offset. K-S tests indicate that all bins are not drawn from the same distribution. Right: NaI D EW vs normalised offset. SNe located in spirals and ellipticals are highlighted as blue stars and green crosses, respectively. At the top of the figure, n = 667 is the number of events, rS = −0.44 is the Spearman correlation coefficient, and P = 6.3 × 10⁻³³ is the probability of detecting a correlation by chance. The vertical dash-dotted lines represent the 25th, 50th and 75th percentiles of the sample from which the cumulative distributions are obtained. The red dashed line is the rolling median, the purple solid line is the exponential fit to the medians, with the shaded purple area indicating the 1σ uncertainty, and the orange line an exponential function from a symbolic regression (see Sect. 4.2).
Current usage metrics show cumulative count of Article Views (full-text article views including HTML views, PDF and ePub downloads, according to the available data) and Abstracts Views on Vision4Press platform.
Data correspond to usage on the plateform after 2015. The current usage metrics is available 48-96 hours after online publication and is updated daily on week days.
Initial download of the metrics may take a while.