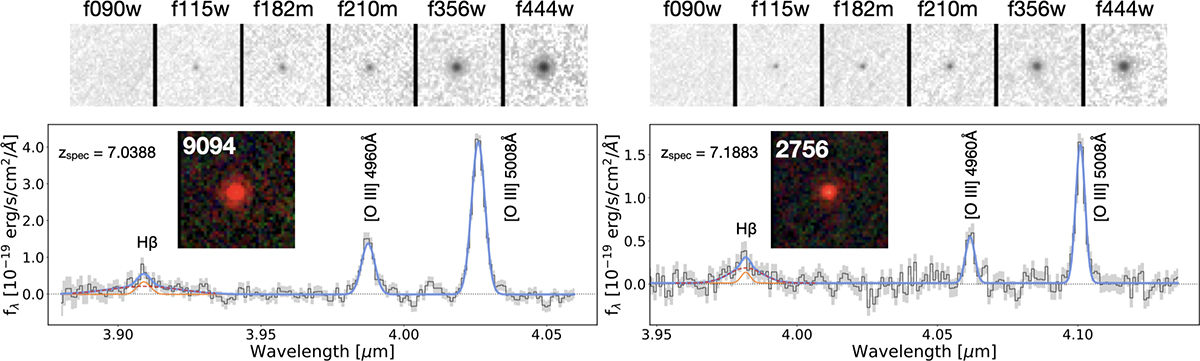
Fig. 1.
Download original image
JWST images and spectra of the two sources. Top: 2″ × 2″ stamps obtained in JWST/NIRCam filters (0.90 μm, 1.15 μm, 1.82 μm, 2.10 μm, 3.56 μm, and 4.44 μm). Bottom: 1D spectra (covering Hβ, [O III] λλ4960, 5008 Å emission lines) obtained from NIRCam/grism observations with the F410M filter, with RGB images embedded (F182M in blue, F210M in green, and F444W in red). The gray-shaded areas show the associated 1σ uncertainty. The best-fit Gaussian line model is shown in blue. Both sources have a broad Hβ line; the solid orange line shows the narrow component, and the dashed red line shows the broad component.
Current usage metrics show cumulative count of Article Views (full-text article views including HTML views, PDF and ePub downloads, according to the available data) and Abstracts Views on Vision4Press platform.
Data correspond to usage on the plateform after 2015. The current usage metrics is available 48-96 hours after online publication and is updated daily on week days.
Initial download of the metrics may take a while.