| Issue |
A&A
Volume 700, August 2025
|
|
|---|---|---|
| Article Number | A231 | |
| Number of page(s) | 12 | |
| Section | Extragalactic astronomy | |
| DOI | https://doi.org/10.1051/0004-6361/202554361 | |
| Published online | 25 August 2025 | |
No [C II] or dust detection in two Little Red Dots at zspec> 7
1
Department of Astronomy, University of Geneva, Chemin Pegasi 51, 1290 Versoix, Switzerland
2
Cosmic Dawn Center (DAWN), Copenhagen, Denmark
3
Niels Bohr Institute, University of Copenhagen, Jagtvej 128, København N, DK-220, Denmark
4
Astronomy Centre, University of Sussex, Falmer, Brighton BN1 9QH, UK
5
Université Paris-Saclay, Université Paris Cité, CEA, CNRS, AIM, 91191 Gif-sur-Yvette, France
6
Institute of Science and Technology Austria (ISTA), Am Campus 1, 3400 Klosterneuburg, Austria
7
Center for Frontier Science, Chiba University, 1-33 Yayoi-cho, Inage-ku, Chiba 263-8522, Japan
8
Steward Observatory, University of Arizona, 933 N Cherry Avenue, Tucson, AZ 85721, USA
9
Department of Astronomy, The University of Texas at Austin, Austin, TX 78712, USA
10
David A. Dunlap Department of Astronomy and Astrophysics, University of Toronto, 50 St. George Street, Toronto, Ontario M5S 3H4, Canada
11
NSF National Optical-Infrared Astronomy Research Laboratory, 950 North Cherry Avenue, Tucson, AZ 85719, USA
12
DTU-Space, Elektrovej, Building 327, 2800 Kgs. Lyngby, Denmark
13
Dipartimento di Fisica e Astronomia, Università di Firenze, Via G. Sansone 1, I-50019 Sesto F.no (Firenze), Italy
14
INAF – Osservatorio Astrofisico di Arcetri, Largo E. Fermi 5, I-50125 Florence, Italy
15
Department of Astrophysical Sciences, Princeton University, 4 Ivy Lane, Princeton NJ 08544, USA
16
School of Astronomy and Space Science, Nanjing University, Nanjing, Jiangsu 210093, China
17
Key Laboratory of Modern Astronomy and Astrophysics, Nanjing University, Ministry of Education, Nanjing 210093, China
18
Department of Astronomy and Astrophysics, University of California, Santa Cruz, CA 95064, USA
19
Kavli Institute for Astronomy and Astrophysics, Peking University, Beijing 100871, China
20
MIT Kavli Institute for Astrophysics and Space Research, 70 Vassar Street, Cambridge, MA 02139, USA
21
Department of Physics and Astronomy, University of California, Riverside, 900 University Avenue, Riverside, CA 92521, USA
22
Department of Physics & Astronomy, University of California, Los Angeles, 430 Portola Plaza, Los Angeles CA 90095, USA
23
Departament d’Astronomia i Astrofìsica, Universitat de València, C. Dr. Moliner 50, E-46100 Burjassot, València, Spain
24
Unidad Asociada CSIC “Grupo de Astrofísica Extragaláctica y Cosmología” (Instituto de Física de Cantabria – Universitat de València), Spain
25
Department of Physics and Astronomy, University of Missouri, 701 S. College Ave., Columbia, MO 65201, USA
26
DARK, The Niels Bohr Institute, Jagtvej 155, 2200 Copenhagen N, Denmark
⋆ Corresponding author: This email address is being protected from spambots. You need JavaScript enabled to view it.
Received:
3
March
2025
Accepted:
1
July
2025
Abstract
Little Red Dots (LRDs) are compact, point-like sources characterized by their red color and broad Balmer lines; it is a matter of debate whether they are dominated by active galactic nuclei (AGNs) or dusty star-forming galaxies (DSFGs). Here we report two LRDs (ID9094 and ID2756) at zspec > 7 recently discovered in the JWST FRESCO GOODS-North field. Both satisfy the “v-shaped” color and compactness criteria for LRDs and are identified as Type-I AGN candidates based on their broad Hβ emission lines (full width at half maximum: 2280 ± 490 km s−1 for ID9094 and 1070 ± 240 km s−1 for ID2756) and narrow [O III] lines (≃300 − 400 km s−1). To investigate their nature, we conducted deep NOEMA follow-up observations targeting the [C II] 158 μm emission line and the 1.3 mm dust continuum. We do not detect [C II] or 1.3 mm continuum emission for either source. If the two LRDs were DSFGs, we would expect significant detections: > 16σ for [C II] and > 3σ for the 1.3 mm continuum of ID9094, and > 5σ for the [C II] of ID2756. Using the 3σ upper limits of [C II] and 1.3 mm, we performed two analyses: (1) UV-to-far-infrared spectral energy distribution fitting with and without AGN components, and (2) comparison of their properties with the L[C II]–SFRtot empirical relation. Both analyses are consistent with a scenario in which AGN activity contributes to the observed properties, though a dusty star-forming origin cannot be fully ruled out. Our results highlight the importance of far-infrared observations for studying LRDs, a regime that remains largely unexplored.
Key words: galaxies: active / galaxies: high-redshift / galaxies: photometry / galaxies: star formation / submillimeter: galaxies
Hubble Fellow.
© The Authors 2025
 Open Access article, published by EDP Sciences, under the terms of the Creative Commons Attribution License (https://creativecommons.org/licenses/by/4.0), which permits unrestricted use, distribution, and reproduction in any medium, provided the original work is properly cited.
This article is published in open access under the Subscribe to Open model. This email address is being protected from spambots. You need JavaScript enabled to view it. to support open access publication.
1. Introduction
Little Red Dots (LRDs; e.g., Fujimoto et al. 2022; Labbe et al. 2025; Matthee et al. 2024; Barro et al. 2024) have emerged as one of the most intriguing populations studied with the JWST (Gardner et al. 2023). The term “LRDs” was first introduced by Matthee et al. (2024) to describe galaxies exhibiting broad Hα emission lines with a red point-source morphology. In a broader context, the name LRD has also been applied to a variety of compact, red sources – predominantly at high redshifts (z ≳ 4) – with “v-shaped” (blue UV and red optical slopes in the rest frame) spectral energy distributions (SEDs), based mainly on photometric measurements only. The samples of these sources overlap, contributing to the complexity of their classification. Most recent studies agree that LRDs involve acombination of stellar and active galactic nucleus (AGN) contributions, although there is ongoing debate over which component dominates (e.g., Wang et al. 2024; Akins et al. 2025a). Some works emphasize a dusty star-forming galaxy-dominated interpretation (e.g., Pérez-González et al. 2024; Labbé et al. 2023; Baggen et al. 2024; Williams et al. 2024), while others find stronger evidence for AGN dominance (e.g., Kocevski et al. 2023, 2025; Greene et al. 2024; Kokorev et al. 2024; Ji et al. 2025; Naidu et al. 2025; de Graaff et al. 2025).
Multiwavelength studies of LRDs have primarily focused on rest-frame UV, optical, near-infrared (NIR), mid-infrared (MIR), X-ray, and radio data, whereas far-infrared (FIR) studies remain relatively scarce in comparison. FIR observations, however, are crucial for disentangling the roles of AGN activity and dusty starburst processes, as they directly probe dust properties, star formation rates (SFRs), and possible AGN contributions. Some studies have started to investigate LRDs in the FIR (e.g., Labbe et al. 2025; Casey et al. 2024, 2025; Akins et al. 2024, 2025b; Williams et al. 2024; Setton et al. 2025), but most rely on photometric redshifts – either through stacked analyses or individual source studies – which might introduce large uncertainties when interpreting their dust properties and star formation activity. Current evidence shows that many LRDs are faint in X-rays (e.g., Ananna et al. 2024; Maiolino et al. 2025; Yue et al. 2024; Sacchi & Bogdan 2025), exhibit weak or no radio emission (e.g., Akins et al. 2024), and lack detectable hot dust in the MIR (e.g., Pérez-González et al. 2024; Williams et al. 2024). These properties could result from heavily obscured AGNs, extreme dusty starbursts, or even hybrid scenarios. Without robust FIR constraints, however, distinguishing between these possibilities remains challenging.
Another potential issue is the partial overlap in photometric selection methods for LRDs (e.g., Labbe et al. 2025; Greene et al. 2024; Kokorev et al. 2024) and optical/NIR-selected dusty star-forming galaxies DSFGs; optically dark or faint galaxies; e.g., Wang et al. 2019; Franco et al. 2018; Alcalde Pampliega et al. 2019; Williams et al. 2019, 2024; Gómez-Guijarro et al. 2023, 2022; Xiao et al. 2023; Barrufet et al. 2023; McKinney et al. 2023; Akins et al. 2023; Pérez-González et al. 2023; Barro et al. 2024) due to their similar red colors. This may pose a challenge for DSFG studies, as optical/NIR-selected DSFGs typically have more relaxed selection criteria that rely solely on color and/or magnitude cuts without considering morphology. As a result, LRDs could inadvertently be included in DSFG samples. Additionally, studies also show that some DSFGs have a compact morphology (e.g., Gómez-Guijarro et al. 2023). This overlap introduces ambiguity, as the two populations could appear in the same sample category despite potentially distinct physical origins. For example, DSFGs are typically powered by intense star formation obscured by large amounts of dust, while AGN-driven LRDs may exhibit similar photometric properties due to their reddened SEDs but have fundamentally different drivers of energy output.
In this study we investigated two LRDs, ID9094 and ID27561, located in the JWST FRESCO GOODS-North field (Oesch et al. 2023). Due to the overlap in photometric selection criteria between DSFGs and LRDs, these two sources were initially classified as optically faint, dust-obscured galaxy candidates with red colors (F182M − F444W > 1.5 mag) and as the most massive candidates at zspec > 7 (M⋆ > 1010 M⊙) based on optical-to-NIR SED fitting (Xiao et al. 2024). However, deep JWST NIRCam grism spectra later revealed the presence of broad Hβ emission lines (a broad component with a full width at half maximum > 1000 km s−1; e.g., Matthee et al. (2024); Sect. 2.4)2, along with a red, point-source-like morphology, indicating potential AGN activity.
To further investigate their nature, we present follow-up FIR observations from NOEMA (The Northern Extended Millimetre Array) targeting the [C II] 158 μm emission line and the 1.3 mm dust continuum. This study, together with the recent work by Setton et al. (2025), represents one of the first efforts to investigate LRDs with both dust and [C II] emission. Setton et al. (2025) focus on two of the most luminous LRDs at zspec ∼ 3 − 4.5 and report a deficit of hot and cold dust emission. In comparison, our study targets two LRDs at zspec > 7, a redshift regime more representative of the typical LRD population identified in JWST surveys. Together, the two studies provide a more complete view of the dust and gas properties of LRDs. Our NOEMA observations provide crucial constraints on the dust temperature, allowing us to assess whether the observed properties of these LRDs are consistent with DSFGs or if AGN-driven processes dominate. By combining FIR data with existing multiwavelength photometry, this work addresses the critical question of whether DSFG scenarios can be ruled out for LRDs in the absence of spectroscopic confirmation.
This paper is organized as follows. In Sect. 2 we describe the data and observational details. Section 3 presents our results, including the non-detection of the dust continuum and [C II] line in the FIR and its implications for the nature of these LRDs. In Sect. 4 we discuss the impact of LRDs on our understanding of DSFGs. We summarize our conclusions in Sect. 5.
Throughout this paper we adopt a Chabrier initial mass function (IMF; Chabrier 2003) to estimate SFRs and stellar masses. We assume a Planck cosmology (Planck Collaboration VI 2020) with (Ωm, ΩΛ, h, σ8) = (0.3, 0.7, 0.7, 0.81). When necessary, data from the literature have been converted with a conversion factor of M⋆ (Salpeter 1955, IMF) = 1.7 × M⋆ (Chabrier 2003, IMF). All magnitudes are in the AB system (Oke & Gunn 1983), such that mAB = 23.9 − 2.5 × log(Sν [μJy]).
2. Data and sample
The two sources ID9094 (α, δ [J2000] = 189.019240, 62.243531) at zspec = 7.0388 ± 0.0001 and ID2756 (α, δ [J2000] = 189.083488, 62.202579) at zspec = 7.1883 ± 0.0001 are located in the GOODS-N field, and were first discovered in the JWST FRESCO survey (Oesch et al. 2023) and reported in Xiao et al. (2024). They have red colors (F182M − F444W > 1.5 mag) and are faint in the F182M band (F182M > 26.4 mag). As such, they were selected as optically faint dusty galaxy candidates, with high inferred stellar masses. In this study, based on their broad Hβ emission line, “v-shaped” colors, and compact morphology in F444W, we now identify both sources as LRDs, following commonly used criteria (e.g., Matthee et al. 2024; Labbe et al. 2025; Greene et al. 2024; Kokorev et al. 2024; Kocevski et al. 2025; see details in Sect. 2.4).
2.1. JWST observations
The two sources were initially observed by the JWST FRESCO survey (Oesch et al. 2023), which provides NIRCam/grism spectroscopy in the F444W filter and direct imaging in F182M, F210M, and F444W over ∼62 arcmin2 in each GOODS field, North and South. The grism spectra cover a wavelength range of 3.8–5.0 μm at a resolution of R ∼ 1600, reaching a 5σ line sensitivity of ∼1.3 × 10⁻¹⁸ erg s−1 cm−2. The images reach typical 5σ depths of 28.3, 28.1, and 28.2 mag, respectively, in a 0 16 circular aperture. Data reduction was performed using the grizli pipeline3, including continuum subtraction and optimal 1D spectral extraction.
Recently, we obtained deeper NIRCam/grism spectroscopy from a Cycle 3 JWST program (GO-4762; PIs: S. Fujimoto & G. Brammer), using the F410M filter instead of F444W. This choice improves spectral sensitivity by blocking the high thermal background beyond 4.4 μm, at the cost of reduced wavelength coverage. Despite a slightly shorter exposure time (by a factor of 1.3) than FRESCO, this dataset thus achieves a 5σ line sensitivity of ∼7.8 × 10⁻¹⁹ erg s−1 cm−2. The continuum subtraction was optimized to explicitly mask emission lines and a wide kernel with a large central hole (151 and 31 pixels, respectively; for the running median) to prevent the over-subtraction of broad wings (see Matthee et al. 2024).
The NIRCam images and grism spectra of ID9094 and ID2756 are shown in Fig. 1, updated with the latest data.
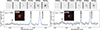 |
Fig. 1. JWST images and spectra of the two sources. Top: 2″ × 2″ stamps obtained in JWST/NIRCam filters (0.90 μm, 1.15 μm, 1.82 μm, 2.10 μm, 3.56 μm, and 4.44 μm). Bottom: 1D spectra (covering Hβ, [O III] λλ4960, 5008 Å emission lines) obtained from NIRCam/grism observations with the F410M filter, with RGB images embedded (F182M in blue, F210M in green, and F444W in red). The gray-shaded areas show the associated 1σ uncertainty. The best-fit Gaussian line model is shown in blue. Both sources have a broad Hβ line; the solid orange line shows the narrow component, and the dashed red line shows the broad component. |
2.2. NOEMA observations
The NOEMA observations of ID9094 and ID2756 were carried out in the summer of 2023 using the PolyFiX correlator (Project ID: S23CY, PIs: D. Elbaz & M. Xiao). Conducted with array configuration D in band 3, the observations targeted the [C II] 158 μm emission line, and the 1.3 mm dust continuum, with representative frequencies of 232.052 GHz for ID9094 and 236.576 GHz for ID2756. The total on-source time was 6 hours and 4.5 hours for ID2756 and ID9094, respectively.
All the calibrations and the creation of uv table were performed using CLIC package from the IRAM GILDAS software4 with the support of IRAM astronomers. We then performed further analysis with version 6.5.5 of the Common Astronomy Software Application (CASA) package (McMullin et al. 2007).
For the [C II] 158 μm emission line, imaging was carried out using the tclean task with 0.4″ pixels and a channel width of 50 km s−1 with a natural weighting. The natural weighting provides the best point-source sensitivity, which is optimal for source detection. The resulting data cube has a synthesized beam size of full width at half maximum (FWHM) ≃1 838 × 1
 472 (∼9.8 kpc × 7.8 kpc in physical scale) and 2
 859 × 1
 854 (∼15.0 kpc × 9.7 kpc) with a root mean square (rms) sensitivity of ∼0.45 and 0.84 mJy beam−1 per channel at the phase center, for ID9094 and ID2756, respectively.
We also created the observed 1.3 mm continuum maps using natural weighting and the same method as for the [C II] 158 μm emission line. For ID9094, the rms level is ∼30.4 μJy beam−1 in the map of 1 725 × 1
 383 (∼9.2 kpc × 7.4 kpc) angular resolution. For ID2756, the rms level is ∼50.3 μJy beam−1 in the map of 2
 712 × 1
 743 (∼14.3 kpc × 9.2 kpc) angular resolution.
2.3. Multiwavelength observations
Besides the JWST FRESCO and NOEMA observations, the two sources are also covered by a wide array of multiwavelength observations. In Table 1, we summarize the multiwavelength dataset for our two sources from X-ray to radio: (i) X-ray: Chandra 2 Ms (0.5–7.0 keV, 0.5–2.0 keV, and 2–7 keV bands) images in the Chandra Deep Field-North field (CDF-N; Xue et al. 2016); (ii) Hubble Space Telescope (HST) ACS (F435W, F606W, F775W, F814W, F850LP) and HST/WFC3 (F105W, F125W, F140W, F160W) images from the Hubble Legacy Fields (HLF)5 program (Whitaker et al. 2019; iii) JWST/NIRCam (F090W, F115W, F150W, F182M, F200W, F210M, F356W, and F444W) from FRESCO (Oesch et al. 2023), CONGRESS (Egami et al. 2023), and JADES (Eisenstein et al. 2023; D’Eugenio et al. 2025). The two sources are not yet covered by any publicly available JWST/MIRI observations; (iv) Spitzer/IRAC from the GREATS program (3.6 μm, 4.5 μm, 5.8 μm, 8 μm; Stefanon et al. 2021, new catalogs based on FRESCO sources are taken from Stefanon et al. in prep.; priv. comm.); (v) Spitzer/MIPS, Herschel/PACS, and SPIRE catalog is taken from the GOODS-Herschel survey (Elbaz et al. 2011; vi) JCMT/SCUBA-2 at 850 μm (Cowie et al. 2017; vii) NOEMA data from this study (see Sect. 2.2); (viii) NIKA2 Cosmological Legacy Survey at 1.2 mm and 2.0 mm (Bing et al. 2023); and (ix) VLA 1.5 GHz (Owen 2018).
Flux or flux densities of two LRDs from multiwavelength observations.
We note that the photometric measurements from HST and JWST images are derived following the same procedure as outlined in Weibel et al. (2024). Briefly, we used SExtractor (Bertin & Arnouts 1996) in dual image mode with an inverse-variance weighted stack of the F210M + F444W with FRESCO-only imaging, as the detection image. In this study, fluxes were measured in 0 16 radius circular apertures in images that are point spread function (PSF)-matched to the F444W band. Total fluxes were derived from the Kron AUTO aperture provided by SExtractor in the F444W band, in addition to a correction based on the encircled energy of the Kron aperture on the F444W PSF. Detailed descriptions of data reduction and photometric measurements are provided in Weibel et al. (2024) and Xiao et al. (2024).
2.4. Our sample: Two “Little Red Dots” at zspec> 7
Although there is no uniform definition of LRDs, we identified our two sources as LRDs because they satisfy both of two commonly used selection criteria: (1) an initial criterion – sources with broad Balmer emission lines (νFWHM, broad > 1000 km s−1; Matthee et al. 2024); and (2) a widely used criterion based only on photometric measurements – a combination of “v-shaped” SED and compactness selection (e.g., Labbe et al. 2025; Kokorev et al. 2024; Greene et al. 2024; Kocevski et al. 2025).
Figure 1 presents the JWST/NIRCam images and grism spectra of ID9094 and ID2756. The red-green-blue (RGB) images show that both sources appear red with point-like morphology. The grism spectra show Hβ and [O III] λλ4960, 5008 emission lines. Both sources exhibit a broad Hβ line. We fit the Hβ line with both narrow and broad Gaussian components, assuming the narrow component has the same width as the [O III] λλ4960, 5008 lines. The best-fit line properties are shown in Table 2. The broad component of Hβ has a FWHM of νFWHM, Hβ, broad = 2280 ± 490 km s−1 for ID9094 and νFWHM, Hβ, broad = 1070 ± 240 km s−1 for ID2756, suggesting a possible Type I (broad emission line) AGN. Notably, ID2756 has also been identified as a strong Lyman-α emitter, with a considerable equivalent width of 221 Å (Leonova et al. in prep.).
Best-fit emission line properties from JWST/NIRCam F410M grism spectra, and best-fit UV and optical slopes from photometric bands.
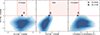 |
Fig. 2. Locations of the two sources (red and blue stars) relative to the typical color and compactness selection criteria for LRDs. The red-shaded regions highlight LRDs that have a “v-shaped” SED (left), red colors (middle), and a compact morphology (right), defined by the criteria: −0.5 < F115W−F200W < 1.0, F277W−F444W > 1.0, F277W−F356W > 0.6, and |

We further compared our two sources to an alternative color and compactness selection criterion for LRDs, designed to identify compact, red objects with “v-shaped” SEDs (e.g., Kokorev et al. 2024; Greene et al. 2024):
Both sources are bright in F444W, with magnitudes of 24.0 ± 0.1 mag (ID9094) and 25.0 ± 0.1 mag (ID2756), consistent with the LRD selection. Since ID2756 lacks observations in F277W and F200W, while ID9094 is missing F277W, the corresponding fluxes used here are derived from the best-fit SED and the 16th–84th percentile range (as shown later in Fig. 4). The detailed comparison is shown in Fig. 2. ID9094 lies within the red region, perfectly matching the LRD selection. ID2756 exhibits a “v-shaped” color and compact morphology, aligning with the LRD classification. Its F277W – F356W color is slightly bluer than the selection threshold but still within the 1σ uncertainty. We therefore classify both sources as LRDs. Compared to the majority of sources from various JWST blank legacy fields (blue-shaded region in Fig. 2), obtained from the DAWN JWST Archive (DJA6; Valentino et al. 2023), these two LRDs stand out as particularly exceptional, exhibiting redder colors and more compact morphologies.
To further quantify the “v-shaped” SEDs, we also measured the UV and optical continuum slopes (βUV and βopt) using multi-band photometry, following the method of Kocevski et al. (2025). Both sources satisfy their LRD selection criteria (−2.8 < βUV < −0.37 and βopt > 0). The measured slope values are listed in Table 2. In addition, both sources are unresolved in F444W, further supporting that they are typical LRDs.
Altogether, we find that both sources are consistent with standard criteria for LRDs based on their morphology and “v-shaped” SED. In addition, both sources show the broad Hβ line, making them strong Type I AGN candidates.
3. Results
3.1. Non-detections in both [C II] 158 μm and 1.3 mm of two LRDs
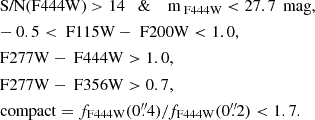
We analyzed the NOEMA data cubes and extracted spectra at the positions of our sources using an aperture consistent with the beam size. The resulting spectra, shown in Fig. 3, reveal no significant signal at the expected [C II] frequency (≪3σ). Assuming a [C II] 158 μm line width of 250 km s−1 – a typical value for high-redshift galaxies (Béthermin et al. 2020; Endsley et al. 2022) – we constructed the velocity-integrated intensity map (moment-0). Figure 3 overlays the contours from the [C II] moment-0 and 1.3 mm maps on the JWST RGB image, showing no detections (≪3σ) at the source positions and in the surrounding regions. We therefore conclude that neither the [C II] 158 μm emission line nor the 1.3 mm dust continuum emission are detected for the two LRDs in the current NOEMA data.
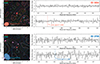 |
Fig. 3. No detection of the [C II] 158 μm emission line or 1.3 mm dust continuum with NOEMA observations. Left: [C II] 158 μm line moment-0 map (assuming a line width of 250 km s−1) and 1.3 mm dust contours overlaid on the JWST RGB image (10″ × 10″). The contour levels start at 1σ and increase in steps of ±1σ, where positive and negative contours are solid and dashed, respectively. The beam sizes are displayed in the lower-left corner. Right: NOEMA 1.3 mm spectra with 50 km s−1 binning. The gray lines show the associated 1σ uncertainty. The vertical dashed lines highlight the locations of [C II] 158 μm. The spectra are taken at the positions of the sources and match the apertures of the beam sizes, assuming the emission line is unresolved. |
We then determined 3σ upper limits for both [C II] and dust continuum. Using the rms of the 1.3 mm map (see Sect. 2.2) and assuming our sources are not resolved, we derive 3σ upper limits of 91 μJy and 151 μJy for ID9094 and ID2756, respectively. In addition, the 3σ upper limits for [C II] are calculated as three times the pixel-by-pixel rms of the moment-0 map, which gives upper limits of 0.157 Jy km s−1 and 0.310 Jy km s−1 for ID9094 and ID2756, respectively. The corresponding 3σ upper limits on the [C II] emission-line luminosity are log(L[C II]/L⊙) < 8.23 for ID9094 and log(L[C II]/L⊙) < 8.58 for ID2756. Using L[C II], we further calculate the 3σ upper limits on the molecular gas mass (Zanella et al. 2018) to be log(Mmol/M⊙) < 9.7 for ID9094 and log(Mmol/M⊙) < 10.1 for ID2756.
Intriguingly, when requesting the NOEMA observations, we assumed these two galaxies to be DSFGs. Given their stellar masses from Xiao et al. (2024), we estimated their total SFRs (SFRtot) assuming that they lie on the star-forming main sequence (Schreiber et al. 2015) and predicted their expected [C II] fluxes using the L[C II]–SFRtot relation for SFGs (Schaerer et al. 2020). Similarly, we estimated their 1.3 mm continuum fluxes by assuming an infrared SED shape consistent with typical dust-obscured galaxies (optically dark or faint galaxies; Xiao et al. 2023). Given the depth of our NOEMA observations, we expected ID9094 to be detected at > 16σ in [C II] and > 3σ in the 1.3 mm continuum, while ID2756 should be detected in [C II] at > 5σ. However, the complete absence of [C II] and 1.3 mm emission suggests that these two LRDs are not the typical DSFGs initially assumed. This result aligns with our findings in Sect. 2.4: both sources exhibit a broad Hβ emission line, being Type-I AGN candidates.
3.2. The hints of AGNs in two LRDs from FIR non-detections
In this section we utilize the 3σ upper limits on the [C II] 158 μm emission line and the 1.3 mm continuum to investigate the possible presence of AGN activity in the LRDs. While both sources have already been identified as strong Type-I AGN candidates based on their broad Hβ emission lines, our primary goal here is to investigate whether the FIR non-detections can effectively rule out the DSFG scenario for LRDs, independently of spectral information. Here, we focus primarily on ID9094, which benefits from deeper NOEMA observations compared to ID2756, allowing for more robust constraints. We assessed the AGN contribution through two independent approaches: (1) UV-to-FIR SED fitting analysis and (2) the L[C II]–SFRtot empirical relation.
3.2.1. SED fitting analysis
We performed a UV-to-FIR SED fitting analysis using CIGALE (Boquien et al. 2019), which is based on an energy balance principle, fixing the redshift to zspec. We assumed a constant star formation history and adopted Bruzual & Charlot (2003) stellar population models with the Calzetti et al. (2000) dust attenuation law. We adopted a broad metallicity range of 0.004–0.02, dust attenuation to the rest-frame V band (AV) values from 0 to 6 magnitudes, and ionization parameters log U of −2.0. The AGN component was modeled using the Fritz et al. (2006) template, with the AGN fraction (fAGN), i.e., the contribution of the AGN to the total IR luminosity, ranging from 0.01 to 0.8. The angle between the equatorial axis and the viewing angle at the line of sight (Ψ) ranges from 40 to 90. With a fixed open angle of the AGN torus at 100 degrees, this range of Ψ refers to Type I AGNs. We note that recent MIR observations (Wang et al. 2025; Williams et al. 2024; Barro et al. 2024) suggest a lack of hot torus dust emission in LRDs, which may deviate from the Fritz et al. (2006) template adopted. However, with the absence of deep MIR observations, we anticipate little change in the quality of SED fitting on our sample by only changing the AGN torus emission in the templates. On the contrary, the inclusion of continuum from accretion disk by limiting Ψ to Type I AGNs is critical, as we robustly detected broad lines in Hβ.
Given that we only have upper limits in the FIR, we adopted a simple FIR dust model from Casey (2012), using the default dust emissivity index (β = 2.0) and MIR power-law slope (α = 2.0). Compared to β = 1.5, which is adopted in some studies of DSFGs (e.g., Hildebrand 1983; Kovács et al. 2006; Gordon et al. 2010; Gómez-Guijarro et al. 2022; Xiao et al. 2023), our choice of β = 2.0 is more conservative and leads to slightly lower inferred dust temperatures for a given FIR slope. During the fitting process, we find that when the dust temperature (Tdust) is allowed to vary across a defined range, the best-fit Tdust is strongly influenced by the upper boundary of the input range. This effect arises due to the absence of deep MIR data, which prevents us from constraining the maximum Tdust. Consequently, we cannot determine a precise best-fit value for Tdust, but the deep NOEMA data allow us to place a lower limit.
To refine our constraints, we adopted an optimized fitting approach that allowed us to constrain the minimum allowed Tdust-pagination using the NOEMA 1.3 mm 3σ upper limits. In this approach, we fixed Tdust during the fitting and performed multiple fits with different Tdust values, ranging from 30 K to 150 K. In addition, we also corrected the effect of the cosmic microwave background (CMB) as an observing background on photometry, following da Cunha et al. (2013). The CMB has the effect of raising the apparent dust temperature with increasing redshift, as the CMB temperature scales with redshift and provides an additional background source of radiation for dust heating. We assumed β = 2.0, consistent with previous studies for z ∼ 7 galaxies (Sommovigo et al. 2022). In this way, we derived the intrinsic FIR photometry starting from MIPS 70 μm, which was used for SED fitting. The best-fit SEDs, with and without AGN components considered, are presented in Fig. 4.
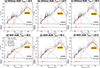 |
Fig. 4. Best-fit SEDs of ID9094 with fixed dust temperatures, providing the first hint of an AGN scenario in this work. Top panels: Best-fit SEDs without an AGN component. Bottom panels: Best-fit SEDs with an AGN component. The 3σ upper limit from NOEMA 1.3 mm, the deepest FIR photometric constraint, is highlighted; it plays a key role in shaping the FIR SED and constraining the lower limit of Tdust. The FIR photometry has been corrected for CMB effects. We show three representative Tdust during the fitting with and without an AGN component, which results in the predicted 1.3 mm flux exceeding (a and d), equal to (b and e), and below (c and f) the observed 3σ upper limit. Panel d shows the fit with an AGN and Tdust = 40 K, which slightly exceeds the 3σ limit but is not ruled out given the model degeneracy and observational uncertainties (see Sect. 3.2.1). Without an AGN, the SED fitting requires Tdust ≳ 110 K. This value significantly exceeds the typical Tdust ∼ 40 K observed in REBELS galaxies at similar redshifts (Sommovigo et al. 2022), and may indicate additional dust heating mechanisms such as AGN activity. In contrast, including an AGN component (bottom panels) allows acceptable fits with Tdust as low as ∼40–60 K, similar to AGNs and/or quasar host galaxies at z > 4 (∼40 − 100 K; e.g., Walter et al. 2022; Tsukui et al. 2023; Tripodi et al. 2023; Decarli et al. 2023), supporting the presence of an AGN in ID9094. |
For ID9094, without including an AGN component (Fig. 4-top), we present three representative examples of best-fit SEDs with (a) Tdust = 40 K, (b) Tdust = 110 K, and (c) Tdust = 150 K. These correspond to results that the predicted flux density at 1.3 mm exceeds, matches, and falls below the observed 3σ upper limits, respectively, under the energy balance assumption of CIGALE. At Tdust = 40 K – a typical value for star-forming UV-bright galaxies in the REBELS survey at z ∼ 7 (Sommovigo et al. 2022) – the predicted 1.3 mm flux exceeds the observed 3σ upper limit by nearly a factor of 3. This discrepancy suggests that, with our current NOEMA observations, we should have detected the source at a significance level of ∼8σ, which is clearly not the case. As Tdust increases, the peak of the FIR SED moves toward the shorter wavelength and the fit improves. At Tdust = 110 K (Fig. 4-b), the predicted 1.3 mm flux aligns with the observed 3σ upper limit. However, given that the actual signal-to-noise ratio at 1.3 mm is well below 3σ, this implies that the real Tdust would be greater than 110 K.
Therefore, without including an AGN component, we obtain a lower limit of Tdust ≳ 110 K. At fixed Tdust = 110 K, as in Table 3, the best-fit IR luminosity is  ,
,  yr−1 (we use this for the analysis in Sect. 3.2.2), and stellar mass of
  . Remarkably, even this lower limit is significantly higher than the typical Tdust ∼ 40 K observed in REBELS galaxies at similar redshifts (Sommovigo et al. 2022). Similar findings have been reported in studies of 675 LRDs at z ≳ 4, regardless of heating mechanism, whether AGNs or star formation, where an average luminosity-weighted dust temperature of Tdust = 110 K is reported (Casey et al. 2024). Such an extreme dust temperature is challenging to explain solely through heating by star formation. In typical star-forming galaxies, the dust temperature is primarily driven by the ultraviolet radiation field of young stars, which is usually insufficient to reach the high Tdust values observed here (see, e.g., Harshan et al. 2024; Laporte et al. 2017).
CIGALE best-fit results for ID9094, with and without an AGN component.
Based on the best-fit LIR without AGNs at fixed Tdust = 110 K, we derived the dust emitting region size Rd ∼ 75 pc, based on a blackbody assumption7. A crucial parameter to consider is the stellar surface density, given by Σ⋆ = M⋆/2πRd2 ∼ 106 M⊙ pc−2 (similar findings are reported in, e.g., Baggen et al. 2024). This is about one order of magnitude higher than the densest systems in the local universe (Hopkins et al. 2010) and star-forming galaxies at z ∼ 5 − 14 observed by JWST (Morishita et al. 2024; Schaerer et al. 2024), highlighting a general issue for LRD models that rely solely on stellar components. Expanding the star formation region would reduce Σ⋆, but it would also decrease Tdust below the observed values (e.g., De Rossi et al. 2018), leading to an inconsistency with our findings. These values are difficult to explain through star formation alone under standard assumptions and may suggest the contribution of additional heating sources, such as AGN activity. However, we emphasize that this interpretation remains model-dependent, and we further discuss such caveats in Sect. 3.2.3.
When the AGN component is included in the SED fitting (Fig. 4-bottom), the results become more physically plausible. Similar to Fig. 4-top, we also show three representative examples of best-fit SEDs with (d) Tdust = 40 K, (e) Tdust = 60 K, and (f) Tdust = 110 K. However, due to the degeneracy between the dust temperature and the AGN fraction, the current upper limit at 1.3 mm does not allow us to place a meaningful lower limit on Tdust. The observed photometry is consistent with SED fits with Tdust = 60 K and even marginally consistent with Tdust down to ∼40 K, a value comparable to those observed in AGNs and/or quasar host galaxies at z > 4 (∼40 − 100 K; e.g., Walter et al. 2022; Tsukui et al. 2023; Tripodi et al. 2023; Decarli et al. 2023; Meyer et al. 2025). At fixed Tdust = 60 (40) K, the best-fit AGN fraction is fAGN = 0.44 ± 0.12 (0.58 ± 0.12), indicating a scenario where both AGNs and star formation contribute significantly to the FIR emission. The corresponding best-fit LIR, SFR, and M⋆ are listed in Table 3. We also note that both sources are covered by the MEOW survey (JWST Cycle 3 GO-5407; PI: G. Leung; priv. comm.), which detects both in F1000W and ID9094 as well as in F2100W. Although the fluxes are not yet publicly released, preliminary analysis suggests that ID9094 exhibits significant hot dust emission in the MIR (G. Leung, priv.comm.).
For ID2756, we performed SED fitting using the same strategy as for ID9094 (see Appendix A). However, the current 1.3 mm observations for ID2756 (rms level ∼50.3 μJy beam−1) are not sufficiently deep to constrain the SED effectively. The lack of sensitivity prevents us from distinguishing between the DSFG and AGN scenarios based solely on the SED fitting results. To achieve meaningful constraints, deeper FIR/submillimeter observations are required. Specifically, observations at least as deep as for ID9094 (rms level ∼30.4 μJy beam−1) are necessary to provide tighter limits on the 1.3 mm flux density and help refine the SED fitting.
3.2.2. L[C II]–SFRtot relation
In this section we compare the locations of our LRDs with the well-established L[C II]–SFRtot scaling relation to investigate their alignment with expectations for star-forming galaxies or the potential influence of AGN activity. The L[C II]–SFRtot relation has been shown to hold across a wide range of redshifts, with no significant evolution observed up to z ∼ 9 (e.g., Lagache et al. 2018; Schaerer et al. 2020; Carniani et al. 2020; Pallottini et al. 2022). Additionally, studies indicate that the relation is consistent for both AGN-hosting galaxies and typical star-forming galaxies, suggesting that the presence of AGNs does not significantly alter the global L[C II]–SFRtot relation (e.g., Herrera-Camus et al. 2018).
For ID9094, when no AGN component is included in the SED fitting, the SFR derived corresponds to Tdust = 110 K. Combining this SFR with the 3σ upper limits of the L[C II] (log(L[C II]/L⊙) < 8.23; Sect. 3.1) places ID9094 significantly below the L[C II]–SFRtot relation, with a deviation of ∼1 dex (see Fig. 5). This large offset suggests that the observed properties of ID9094 may not be fully explained by typical star formation processes in DSFGs. In contrast, when including an AGN component in the SED fitting, the resulting SFR with the Tdust = 60 K template is about four times lower than that returned by SED fitting without an AGN component. In this case, ID9094 lies within the scatter of the L[C II]–SFRtot relation, indicating consistency with the scaling relation. We note that including an AGN component with Tdust = 40 K results in a lower SFR and brings ID9094 into even better agreement with the L[CII]–SFRtot relation.
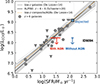 |
Fig. 5. [C II] luminosity as a function of SFR, providing the second hint of an AGN scenario in this work. ID9094 is shown with 3σ upper limits on L[C II] (L[C II] < 1.7 × 10⁸ L⊙) in red and blue arrows, representing cases with (fixed Tdust = 60 K) and without (fixed Tdust = 110 K) an AGN component, respectively. We note that results for Tdust = 40 K with an AGN component are not shown here, as they yield similar or even better agreement with the relation (see Sect. 3.2.2). The blue square indicates the expected L[C II] location of ID9094 if it is a star-forming galaxy without an AGN. Solid gray and black lines, along with their shaded regions, represent the L[C II]–SFR relations and 1σ uncertainties for low-redshift galaxies (De Looze et al. 2014) and high-redshift ALPINE galaxies (z ∼ 4 − 6; Schaerer et al. 2020), respectively. The dashed orange line shows the relation for low-z composite galaxies and AGNs (De Looze et al. 2014). Previous observations of z > 6 galaxies are plotted as gray points or downward triangles, which represent 3σ upper limits (Harikane et al. 2020; Schouws et al. 2023; Fudamoto et al. 2024). |
For ID2756, its 3σ upper limits of the [C II] emission line luminosity is log(L[C II]/L⊙) < 8.58 (Sect. 3.1). Due to the shallower NOEMA observations, we cannot constrain SFR well with and without AGN components in the SED (as described in Sect. 3.2.1). Therefore, we are unable to place meaningful constraints on its position in the L[C II] versus SFRtot plane without deeper FIR observations.
3.2.3. Caveats
Our analysis provides constraints on the dust and gas properties of the two LRDs. For ID9094, the two independent analyses of Tdust and the L[CII]–SFRtot relation show notable deviations from typical DSFGs. These distinct properties suggest that additional radiation mechanisms, such as AGN activity, contribute to the total emission of this source.
However, we emphasize that the interpretations above rely on several assumptions and modeling choices. First, the lower limit on the dust temperature (Tdust ≳ 110 K) inferred in the absence of an AGN component is derived under fixed SED parameters and based solely on upper limits in the FIR. The resulting value is therefore model-dependent and sensitive to assumptions such as the dust emissivity index and IR SED shape. Moreover, high dust temperatures alone are not sufficient to definitively rule out a purely star-forming scenario. Although rare, some high-redshift galaxies without clear AGN signatures have exhibited elevated Tdust values. For instance, MACS0416-Y1 at z = 8.31 has a Tdust ∼ 80 − 116 K, potentially due to intense starburst activity in a merger-driven system without requiring AGN heating (e.g., Bakx et al. 2020; Fudamoto et al. 2023; Harshan et al. 2024; Sommovigo et al. 2022). Similarly, A2744-YD4 at z = 8.38 shows Tdust ∼ 55 − 107 K, which may be due to its low metallicity and high SFR (e.g., Laporte et al. 2017; Behrens et al. 2018; Sommovigo et al. 2022). These cases are considered extreme and likely involve compact starbursts and low dust content.
Second, the observed offset from the empirical L[CII]–SFR relation is not conclusive evidence against the DSFG scenario. The total SFR estimates are subject to uncertainties, especially when derived from upper limits, and the comparison sample includes a mix of UV-bright and IR-selected galaxies with diverse properties. Moreover, the L[CII]–SFR relation exhibits large scatter at high redshift, and many star-forming galaxies also lie below the relation.
In summary, while our results are more consistent with an AGN-driven scenario, the possibility of dusty star formation remains viable given the current data limitations. Future deeper FIR observations will be essential to distinguish between these scenarios.
4. Impact of LRDs on our understanding of DSFGs
As introduced earlier, the two LRDs analyzed in this study were initially selected as the most massive DSFG candidates at zspec > 7 in the JWST FRESCO GOODS-North field (Xiao et al. 2024). This misclassification arose due to the overlap in selection criteria between LRDs and DSFGs, particularly for optical/NIR-selected DSFGs – often referred to as optically dark or faint galaxies (also known as HST-dark galaxies or H dropouts; e.g., Wang et al. 2019; Alcalde Pampliega et al. 2019; Williams et al. 2019; Xiao et al. 2023; Gómez-Guijarro et al. 2022; Barrufet et al. 2023; Akins et al. 2023; Pérez-González et al. 2023; Barro et al. 2024). Typically, DSFGs identified in optical/NIR observations are selected based on their red colors and rest-frame optical faintness, as these characteristics correlate strongly with dust attenuation at similar redshifts (e.g., Wang et al. 2016; Xiao et al. 2023). Additionally, the optical faintness criterion helps exclude quiescent galaxies, which are generally optically bright. For instance, DSFGs are often selected using a color cut such as F150W–F444W > 1.5 mag and F150W ≳26.5 mag, though specific band choices and thresholds slightly vary across studies.
With the increasing availability of JWST spectroscopic data, emission-line detections have become an additional criterion for DSFG selection (e.g., Xiao et al. 2024; Barrufet et al. 2025). In Xiao et al. (2024), DSFG candidates were selected based on their red color (F182M − F444W > 1.5 mag) and strong emission lines (e.g., Hα + [NII] + [SII] lines or [O III] λλ4960, 5008 + Hβ lines). This approach also allows for the identification of LRDs among DSFG candidates. Among 26 DSFG candidates with detected Hα lines (> 8σ), seven (∼27%) were found to be LRDs, exhibiting broad Hα emission lines (see Matthee et al. 2024).
Over the past decade, numerous studies have shown that optically dark or faint galaxies tend to have high stellar masses and may dominate the massive end of the stellar mass function (e.g., Wang et al. 2019; Gottumukkala et al. 2024). Additionally, these galaxies could contribute significantly to the cosmic star formation rate density (SFRD) at z > 3, with contributions of ∼10 − 50% of the SFRD, depending on the methodology (see a direct comparison in Xiao et al. 2023; e.g., Wang et al. 2019; Williams et al. 2019; Gruppioni et al. 2020; Fudamoto et al. 2021; Talia et al. 2021; Enia et al. 2022; Shu et al. 2022; Barrufet et al. 2023; van der Vlugt et al. 2023). Notably, while different studies employ varying selection criteria for optically dark or faint galaxies, some adopt stricter definitions, requiring FIR/submillimeter (e.g., ALMA/NOEMA) detection and/or non-detection in HST. Given that LRDs have been found to 1) lack FIR/submillimeter detections (see also, e.g., Labbe et al. 2025; Williams et al. 2024), 2) exhibit a characteristic “v-shaped” SED (indicating detection by the HST), they are unlikely to contaminate the DSFG sample in these studies.
On a global scale, these findings suggest that LRD contamination should not significantly bias SFRD estimates derived from DSFG samples. However, their presence may still impact number density estimates of optical/NIR-selected DSFG populations, particularly when broader color-based selection criteria are used. A study with a larger sample is needed to determine how much the number density estimates of DSFG populations are affected by LRDs. These results highlight the importance of refining DSFG selection methods to minimize potential contamination from AGN-dominated LRDs, ensuring a more accurate census of dust-obscured star formation in the early Universe.
5. Conclusions
In this paper we present a study of two LRDs, ID9094 and ID2756, recently discovered in the JWST FRESCO GOODS-North field at zspec > 7. These sources, characterized by their red, point-source-like morphology and “v-shaped” SEDs, exhibit broad Hβ emission lines, which suggests they are AGN candidates. Using NOEMA observations targeting the [C II] 158 μm emission line and the 1.3 mm dust continuum, we obtain the following key results:
-
Both sources are undetected in the [C II] and 1.3 mm continuum. For ID9094, the 3σ upper limits on the [C II] and 1.3 mm continuum are far below expectations for a typical DSFG, which would have been detected at > 16σ in [C II] and > 3σ at 1.3 mm. For ID2756, the expected > 5σ detection in [C II] is also not observed.
-
Benefiting from the 1.3 mm upper limits, we performed UV-to-FIR SED fitting, which provided the first hint of an AGN scenario in this work. For ID9094, without including an AGN component, the SED fit requires an abnormally high dust temperature (Tdust ≳ 110 K), significantly above typical values for star-forming galaxies at similar redshifts. Including an AGN component yields more physically plausible fits with dust temperatures that can be as low as ∼40–60 K. However, we caution that the minimum Tdust is strongly linked to the AGN fraction contributing to the total IR luminosity – higher AGN fractions allow for lower Tdust values. For ID2756, the SED fitting remains inconclusive due to shallower NOEMA data, highlighting the need for deeper FIR/submillimeter observations.
-
Using the [C II] upper limits, we compared the sources to the empirical L[C II]–SFRtot relation; this provides a second hint of an AGN scenario. For ID9094, its [C II] upper limit places it significantly below the scaling relation when no AGN component is included, but consistent with the relation when an AGN contribution is considered. The case for ID2756 remains uncertain due to the limited NOEMA depth.
These results highlight the value of FIR constraints, when combined with shorter-wavelength photometry, in revealing the nature of LRDs – particularly when spectroscopic data are unavailable. For ID9094, the results are consistent with a scenario in which AGN activity contributes to the observed emission, though a dusty star-forming origin cannot be fully excluded given the data limitations. We also note that both sources are detected in JWST/MIRI F1000W, and ID9094 is additionally detected in F2100W, evidence in support of the presence of hot dust emission (G. Leung, priv. comm.). For ID2756, the current observations are insufficient to determine the dominant energy source. We emphasize that our interpretation remains model-dependent and subject to assumptions in the SED fitting and limited FIR constraints. More broadly, this study demonstrates the critical role of FIR data in clarifying the nature of LRDs. Future deeper FIR/submillimeter campaigns, along with high-resolution spectroscopy and multiwavelength data, will be essential to fully understanding the physical properties of these LRDs and their role in early galaxy evolution.
ID9094 and ID2756 correspond to gn17537 and gn28924, respectively, in the FRESCO [O III] catalog (Meyer et al. 2024).
The broad lines were not clearly identified in the initial FRESCO spectra or at the time of the NOEMA proposal, due to the limited sensitivity of the FRESCO data.
LIR ∼ 4πRd2σTdust4 and σ is the Stefan–Boltzmann constant.
Acknowledgments
We are very grateful to the anonymous referee for instructive comments, which helped improve the overall quality and strengthen the analysis of this work. We thank Andrea Weibel for assistance with the HST and JWST photometric measurements used in this paper. This work is based on observations carried out under project number S23CY with the IRAM NOEMA Interferometer. IRAM is supported by INSU/CNRS (France), MPG (Germany) and IGN (Spain). This work is based in part on observations made with the NASA/ESA/CSA James Webb Space Telescope. The data were obtained from the Mikulski Archive for Space Telescopes at the Space Telescope Science Institute, which is operated by the Association of Universities for Research in Astronomy, Inc., under NASA contract NAS 5-03127 for JWST. These observations are associated with programs #1895 and #4762. Support for programs #1895 and #4762 was provided by NASA through a grant from the Space Telescope Science Institute, which is operated by the Association of Universities for Research in Astronomy, Inc., under NASA contract NAS 5-03127. This work has received funding from the Swiss State Secretariat for Education, Research and Innovation (SERI) under contract number MB22.00072, as well as from the Swiss National Science Foundation (SNSF) through project grant 200020_207349. The Cosmic Dawn Center (DAWN) is funded by the Danish National Research Foundation under grant DNRF140. This work is partially supported from the National Natural Science Foundation of China (12073003, 11721303, 11991052), and the China Manned Space Project (CMS-CSST-2021-A04 and CMS-CSST-2021-A06). Y.F. is supported by JSPS KAKENHI Grant Numbers JP22K21349 and JP23K13149. M.V. gratefully acknowledges financial support from the Independent Research Fund Denmark via grant numbers DFF 8021-00130 and 3103-00146 and from the Carlsberg Foundation via grant CF23-0417. VK acknowledges support from the University of Texas at Austin Cosmic Frontier Center. S.F. acknowledges support from NASA through the NASA Hubble Fellowship grant HST-HF2-51505.001-A awarded by the Space Telescope Science Institute, which is operated by the Association of Universities for Research in Astronomy, Incorporated, under NASA contract NAS5-26555. Support for this work for RPN was provided by NASA through the NASA Hubble Fellowship grant HST-HF2-51515.001-A awarded by the Space Telescope Science Institute, which is operated by the Association of Universities for Research in Astronomy, Incorporated, under NASA contract NAS5-26555.
References
- Akins, H. B., Casey, C. M., Allen, N., et al. 2023, ApJ, 956, 61 [NASA ADS] [CrossRef] [Google Scholar]
- Akins, H. B., Casey, C. M., Lambrides, E., et al. 2024, ApJ, submitted [arXiv:2406.10341] [Google Scholar]
- Akins, H. B., Casey, C. M., Berg, D. A., et al. 2025a, ApJ, 980, L29 [Google Scholar]
- Akins, H. B., Casey, C. M., Chisholm, J., et al. 2025b, ApJL, submitted [arXiv:2503.00998] [Google Scholar]
- Alcalde Pampliega, B., Pérez-González, P. G., Barro, G., et al. 2019, ApJ, 876, 135 [NASA ADS] [CrossRef] [Google Scholar]
- Ananna, T. T., Bogdán, Á., Kovács, O. E., Natarajan, P., & Hickox, R. C. 2024, ApJ, 969, L18 [NASA ADS] [CrossRef] [Google Scholar]
- Baggen, J. F. W., van Dokkum, P., Brammer, G., et al. 2024, ApJ, 977, L13 [NASA ADS] [CrossRef] [Google Scholar]
- Bakx, T. J. L. C., Tamura, Y., Hashimoto, T., et al. 2020, MNRAS, 493, 4294 [NASA ADS] [CrossRef] [Google Scholar]
- Barro, G., Pérez-González, P. G., Kocevski, D. D., et al. 2024, ApJ, 963, 128 [CrossRef] [Google Scholar]
- Barrufet, L., Oesch, P. A., Weibel, A., et al. 2023, MNRAS, 522, 449 [NASA ADS] [CrossRef] [Google Scholar]
- Barrufet, L., Oesch, P. A., Marques-Chaves, R., et al. 2025, MNRAS, 537, 3453 [Google Scholar]
- Behrens, C., Pallottini, A., Ferrara, A., Gallerani, S., & Vallini, L. 2018, MNRAS, 477, 552 [NASA ADS] [CrossRef] [Google Scholar]
- Bertin, E., & Arnouts, S. 1996, A&AS, 117, 393 [NASA ADS] [CrossRef] [EDP Sciences] [Google Scholar]
- Béthermin, M., Fudamoto, Y., Ginolfi, M., et al. 2020, A&A, 643, A2 [Google Scholar]
- Bing, L., Béthermin, M., Lagache, G., et al. 2023, A&A, 677, A66 [NASA ADS] [CrossRef] [EDP Sciences] [Google Scholar]
- Boquien, M., Burgarella, D., Roehlly, Y., et al. 2019, A&A, 622, A103 [NASA ADS] [CrossRef] [EDP Sciences] [Google Scholar]
- Bruzual, G., & Charlot, S. 2003, MNRAS, 344, 1000 [NASA ADS] [CrossRef] [Google Scholar]
- Calzetti, D., Armus, L., Bohlin, R. C., et al. 2000, ApJ, 533, 682 [NASA ADS] [CrossRef] [Google Scholar]
- Carniani, S., Ferrara, A., Maiolino, R., et al. 2020, MNRAS, 499, 5136 [NASA ADS] [CrossRef] [Google Scholar]
- Casey, C. M. 2012, MNRAS, 425, 3094 [Google Scholar]
- Casey, C. M., Akins, H. B., Shuntov, M., et al. 2024, ApJ, 965, 98 [NASA ADS] [CrossRef] [Google Scholar]
- Casey, C. M., Akins, H. B., Finkelstein, S. L., et al. 2025, AAS journals, submitted [arXiv:2505.18873] [Google Scholar]
- Chabrier, G. 2003, PASP, 115, 763 [Google Scholar]
- Cowie, L. L., Barger, A. J., Hsu, L. Y., et al. 2017, ApJ, 837, 139 [Google Scholar]
- da Cunha, E., Groves, B., Walter, F., et al. 2013, ApJ, 766, 13 [Google Scholar]
- de Graaff, A., Rix, H.-W., Naidu, R. P., et al. 2025, A&A, in press, https://doi.org/10.1051/0004-6361/202554681 [Google Scholar]
- De Looze, I., Cormier, D., Lebouteiller, V., et al. 2014, A&A, 568, A62 [NASA ADS] [CrossRef] [EDP Sciences] [Google Scholar]
- De Rossi, M. E., Rieke, G. H., Shivaei, I., Bromm, V., & Lyu, J. 2018, ApJ, 869, 4 [Google Scholar]
- Decarli, R., Pensabene, A., Diaz-Santos, T., et al. 2023, A&A, 673, A157 [NASA ADS] [CrossRef] [EDP Sciences] [Google Scholar]
- D’Eugenio, F., Cameron, A. J., Scholtz, J., et al. 2025, ApJS, 277, 4 [Google Scholar]
- Egami, E., Sun, F., Alberts, S., et al. 2023, Complete NIRCam Grism Redshift Survey (CONGRESS), JWST Proposal. Cycle 2, ID. #3577 [Google Scholar]
- Eisenstein, D. J., Willott, C., Alberts, S., et al. 2023, ApJS, submitted [arXiv:2306.02465] [Google Scholar]
- Elbaz, D., Dickinson, M., Hwang, H. S., et al. 2011, A&A, 533, A119 [NASA ADS] [CrossRef] [EDP Sciences] [Google Scholar]
- Endsley, R., Stark, D. P., Bouwens, R. J., et al. 2022, MNRAS, 517, 5642 [NASA ADS] [CrossRef] [Google Scholar]
- Enia, A., Talia, M., Pozzi, F., et al. 2022, ApJ, 927, 204 [NASA ADS] [CrossRef] [Google Scholar]
- Franco, M., Elbaz, D., Béthermin, M., et al. 2018, A&A, 620, A152 [NASA ADS] [CrossRef] [EDP Sciences] [Google Scholar]
- Fritz, J., Franceschini, A., & Hatziminaoglou, E. 2006, MNRAS, 366, 767 [Google Scholar]
- Fudamoto, Y., Oesch, P. A., Schouws, S., et al. 2021, Nature, 597, 489 [CrossRef] [Google Scholar]
- Fudamoto, Y., Inoue, A. K., & Sugahara, Y. 2023, MNRAS, 521, 2962 [NASA ADS] [CrossRef] [Google Scholar]
- Fudamoto, Y., Inoue, A. K., Coe, D., et al. 2024, ApJ, 961, 71 [NASA ADS] [CrossRef] [Google Scholar]
- Fujimoto, S., Brammer, G. B., Watson, D., et al. 2022, Nature, 604, 261 [NASA ADS] [CrossRef] [Google Scholar]
- Gardner, J. P., Mather, J. C., Abbott, R., et al. 2023, PASP, 135, 068001 [NASA ADS] [CrossRef] [Google Scholar]
- Gómez-Guijarro, C., Elbaz, D., Xiao, M., et al. 2022, A&A, 658, A43 [NASA ADS] [CrossRef] [EDP Sciences] [Google Scholar]
- Gómez-Guijarro, C., Magnelli, B., Elbaz, D., et al. 2023, A&A, 677, A34 [NASA ADS] [CrossRef] [EDP Sciences] [Google Scholar]
- Gordon, K. D., Galliano, F., Hony, S., et al. 2010, A&A, 518, L89 [NASA ADS] [CrossRef] [EDP Sciences] [Google Scholar]
- Gottumukkala, R., Barrufet, L., Oesch, P. A., et al. 2024, MNRAS, 530, 966 [NASA ADS] [CrossRef] [Google Scholar]
- Greene, J. E., Labbe, I., Goulding, A. D., et al. 2024, ApJ, 964, 39 [CrossRef] [Google Scholar]
- Gruppioni, C., Béthermin, M., Loiacono, F., et al. 2020, A&A, 643, A8 [NASA ADS] [CrossRef] [EDP Sciences] [Google Scholar]
- Harikane, Y., Ouchi, M., Inoue, A. K., et al. 2020, ApJ, 896, 93 [Google Scholar]
- Harshan, A., Tripodi, R., Martis, N. S., et al. 2024, ApJ, 977, L36 [Google Scholar]
- Herrera-Camus, R., Sturm, E., Graciá-Carpio, J., et al. 2018, ApJ, 861, 95 [Google Scholar]
- Hildebrand, R. H. 1983, Q. J. R. Astron. Soc., 24, 267 [NASA ADS] [Google Scholar]
- Hopkins, P. F., Murray, N., Quataert, E., & Thompson, T. A. 2010, MNRAS, 401, L19 [NASA ADS] [Google Scholar]
- Ji, X., Maiolino, R., Übler, H., et al. 2025, MNRAS, submitted [arXiv:2501.13082] [Google Scholar]
- Kocevski, D. D., Onoue, M., Inayoshi, K., et al. 2023, ApJ, 954, L4 [NASA ADS] [CrossRef] [Google Scholar]
- Kocevski, D. D., Finkelstein, S. L., Barro, G., et al. 2025, ApJ, 986, 126 [Google Scholar]
- Kokorev, V., Caputi, K. I., Greene, J. E., et al. 2024, ApJ, 968, 38 [NASA ADS] [CrossRef] [Google Scholar]
- Kovács, A., Chapman, S. C., Dowell, C. D., et al. 2006, ApJ, 650, 592 [CrossRef] [Google Scholar]
- Labbé, I., van Dokkum, P., Nelson, E., et al. 2023, Nature, 616, 266 [CrossRef] [Google Scholar]
- Labbe, I., Greene, J. E., Bezanson, R., et al. 2025, ApJ, 978, 92 [NASA ADS] [CrossRef] [Google Scholar]
- Lagache, G., Cousin, M., & Chatzikos, M. 2018, A&A, 609, A130 [NASA ADS] [CrossRef] [EDP Sciences] [Google Scholar]
- Laporte, N., Ellis, R. S., Boone, F., et al. 2017, ApJ, 837, L21 [CrossRef] [Google Scholar]
- Maiolino, R., Risaliti, G., Signorini, M., et al. 2025, MNRAS, 538, 1921 [Google Scholar]
- Matthee, J., Naidu, R. P., Brammer, G., et al. 2024, ApJ, 963, 129 [NASA ADS] [CrossRef] [Google Scholar]
- McKinney, J., Pope, A., Kirkpatrick, A., et al. 2023, ApJ, 955, 136 [NASA ADS] [CrossRef] [Google Scholar]
- McMullin, J. P., Waters, B., Schiebel, D., Young, W., & Golap, K. 2007, in Astronomical Data Analysis Software and Systems XVI, eds. R. A. Shaw, F. Hill, & D. J. Bell, ASP Conf. Ser., 376, 127 [Google Scholar]
- Meyer, R. A., Oesch, P. A., Giovinazzo, E., et al. 2024, MNRAS, 535, 1067 [CrossRef] [Google Scholar]
- Meyer, R. A., Walter, F., Di Mascia, F., et al. 2025, A&A, 695, L18 [NASA ADS] [CrossRef] [EDP Sciences] [Google Scholar]
- Morishita, T., Stiavelli, M., Chary, R.-R., et al. 2024, ApJ, 963, 9 [NASA ADS] [CrossRef] [Google Scholar]
- Naidu, R. P., Matthee, J., Katz, H., et al. 2025, ArXiv e-prints [arXiv:2503.16596] [Google Scholar]
- Oesch, P. A., Brammer, G., Naidu, R. P., et al. 2023, MNRAS, 525, 2864 [NASA ADS] [CrossRef] [Google Scholar]
- Oke, J. B., & Gunn, J. E. 1983, ApJ, 266, 713 [NASA ADS] [CrossRef] [Google Scholar]
- Owen, F. N. 2018, ApJS, 235, 34 [Google Scholar]
- Pallottini, A., Ferrara, A., Gallerani, S., et al. 2022, MNRAS, 513, 5621 [NASA ADS] [Google Scholar]
- Pérez-González, P. G., Barro, G., Annunziatella, M., et al. 2023, ApJ, 946, L16 [CrossRef] [Google Scholar]
- Pérez-González, P. G., Barro, G., Rieke, G. H., et al. 2024, ApJ, 968, 4 [CrossRef] [Google Scholar]
- Planck Collaboration VI. 2020, A&A, 641, A6 [NASA ADS] [CrossRef] [EDP Sciences] [Google Scholar]
- Sacchi, A., & Bogdan, A. 2025, ApJL, submitted [arXiv:2505.09669] [Google Scholar]
- Salpeter, E. E. 1955, ApJ, 121, 161 [Google Scholar]
- Schaerer, D., Ginolfi, M., Béthermin, M., et al. 2020, A&A, 643, A3 [NASA ADS] [CrossRef] [EDP Sciences] [Google Scholar]
- Schaerer, D., Marques-Chaves, R., Xiao, M., & Korber, D. 2024, A&A, 687, L11 [NASA ADS] [CrossRef] [EDP Sciences] [Google Scholar]
- Schouws, S., Bouwens, R., Smit, R., et al. 2023, ApJ, 954, 103 [NASA ADS] [CrossRef] [Google Scholar]
- Schreiber, C., Pannella, M., Elbaz, D., et al. 2015, A&A, 575, A74 [NASA ADS] [CrossRef] [EDP Sciences] [Google Scholar]
- Setton, D. J., Greene, J. E., Spilker, J. S., et al. 2025, ApJL, submitted [arXiv:2503.02059] [Google Scholar]
- Shu, X., Yang, L., Liu, D., et al. 2022, ApJ, 926, 155 [NASA ADS] [CrossRef] [Google Scholar]
- Sommovigo, L., Ferrara, A., Pallottini, A., et al. 2022, MNRAS, 513, 3122 [NASA ADS] [CrossRef] [Google Scholar]
- Stefanon, M., Labbé, I., Oesch, P. A., et al. 2021, ApJS, 257, 68 [NASA ADS] [CrossRef] [Google Scholar]
- Talia, M., Cimatti, A., Giulietti, M., et al. 2021, ApJ, 909, 23 [NASA ADS] [CrossRef] [Google Scholar]
- Tripodi, R., Feruglio, C., Kemper, F., et al. 2023, ApJ, 946, L45 [NASA ADS] [CrossRef] [Google Scholar]
- Tsukui, T., Wisnioski, E., Krumholz, M. R., & Battisti, A. 2023, MNRAS, 523, 4654 [NASA ADS] [CrossRef] [Google Scholar]
- Valentino, F., Brammer, G., Gould, K. M. L., et al. 2023, ApJ, 947, 20 [NASA ADS] [CrossRef] [Google Scholar]
- van der Vlugt, D., Hodge, J. A., Jin, S., et al. 2023, ApJ, 951, 131 [NASA ADS] [CrossRef] [Google Scholar]
- Walter, F., Neeleman, M., Decarli, R., et al. 2022, ApJ, 927, 21 [NASA ADS] [CrossRef] [Google Scholar]
- Wang, T., Elbaz, D., Schreiber, C., et al. 2016, ApJ, 816, 84 [Google Scholar]
- Wang, T., Schreiber, C., Elbaz, D., et al. 2019, Nature, 572, 211 [Google Scholar]
- Wang, B., Leja, J., de Graaff, A., et al. 2024, ApJ, 969, L13 [NASA ADS] [CrossRef] [Google Scholar]
- Wang, B., de Graaff, A., Davies, R. L., et al. 2025, ApJ, 984, 121 [Google Scholar]
- Weibel, A., Oesch, P. A., Barrufet, L., et al. 2024, MNRAS, 533, 1808 [NASA ADS] [CrossRef] [Google Scholar]
- Whitaker, K. E., Ashas, M., Illingworth, G., et al. 2019, ApJS, 244, 16 [CrossRef] [Google Scholar]
- Williams, C. C., Labbe, I., Spilker, J., et al. 2019, ApJ, 884, 154 [Google Scholar]
- Williams, C. C., Alberts, S., Ji, Z., et al. 2024, ApJ, 968, 34 [NASA ADS] [CrossRef] [Google Scholar]
- Xiao, M. Y., Elbaz, D., Gómez-Guijarro, C., et al. 2023, A&A, 672, A18 [NASA ADS] [CrossRef] [EDP Sciences] [Google Scholar]
- Xiao, M., Oesch, P. A., Elbaz, D., et al. 2024, Nature, 635, 311 [NASA ADS] [CrossRef] [Google Scholar]
- Xue, Y. Q., Luo, B., Brandt, W. N., et al. 2016, ApJS, 224, 15 [Google Scholar]
- Yue, M., Eilers, A.-C., Ananna, T. T., et al. 2024, ApJ, 974, L26 [CrossRef] [Google Scholar]
- Zanella, A., Daddi, E., Magdis, G., et al. 2018, MNRAS, 481, 1976 [Google Scholar]
Appendix A: Best-fit SED of ID2756 with Tdust = 40 K.
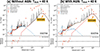 |
Fig. A.1. Similar to Fig. 4 but for ID2756. The 3σ upper limit at 1.3 mm is not sufficiently deep to rule out the low Tdust solution, nor to rule out the scenario without an AGN. Deeper FIR/submillimeter observations, at least similar to those for ID9094 (rms level ∼30.4 μJy beam−1 at 1.3 mm), are needed. |
All Tables
Best-fit emission line properties from JWST/NIRCam F410M grism spectra, and best-fit UV and optical slopes from photometric bands.
All Figures
|
Fig. 1. JWST images and spectra of the two sources. Top: 2″ × 2″ stamps obtained in JWST/NIRCam filters (0.90 μm, 1.15 μm, 1.82 μm, 2.10 μm, 3.56 μm, and 4.44 μm). Bottom: 1D spectra (covering Hβ, [O III] λλ4960, 5008 Å emission lines) obtained from NIRCam/grism observations with the F410M filter, with RGB images embedded (F182M in blue, F210M in green, and F444W in red). The gray-shaded areas show the associated 1σ uncertainty. The best-fit Gaussian line model is shown in blue. Both sources have a broad Hβ line; the solid orange line shows the narrow component, and the dashed red line shows the broad component. |
| In the text | |
|
Fig. 2. Locations of the two sources (red and blue stars) relative to the typical color and compactness selection criteria for LRDs. The red-shaded regions highlight LRDs that have a “v-shaped” SED (left), red colors (middle), and a compact morphology (right), defined by the criteria: −0.5 < F115W−F200W < 1.0, F277W−F444W > 1.0, F277W−F356W > 0.6, and |
| In the text | |
|
Fig. 3. No detection of the [C II] 158 μm emission line or 1.3 mm dust continuum with NOEMA observations. Left: [C II] 158 μm line moment-0 map (assuming a line width of 250 km s−1) and 1.3 mm dust contours overlaid on the JWST RGB image (10″ × 10″). The contour levels start at 1σ and increase in steps of ±1σ, where positive and negative contours are solid and dashed, respectively. The beam sizes are displayed in the lower-left corner. Right: NOEMA 1.3 mm spectra with 50 km s−1 binning. The gray lines show the associated 1σ uncertainty. The vertical dashed lines highlight the locations of [C II] 158 μm. The spectra are taken at the positions of the sources and match the apertures of the beam sizes, assuming the emission line is unresolved. |
| In the text | |
|
Fig. 4. Best-fit SEDs of ID9094 with fixed dust temperatures, providing the first hint of an AGN scenario in this work. Top panels: Best-fit SEDs without an AGN component. Bottom panels: Best-fit SEDs with an AGN component. The 3σ upper limit from NOEMA 1.3 mm, the deepest FIR photometric constraint, is highlighted; it plays a key role in shaping the FIR SED and constraining the lower limit of Tdust. The FIR photometry has been corrected for CMB effects. We show three representative Tdust during the fitting with and without an AGN component, which results in the predicted 1.3 mm flux exceeding (a and d), equal to (b and e), and below (c and f) the observed 3σ upper limit. Panel d shows the fit with an AGN and Tdust = 40 K, which slightly exceeds the 3σ limit but is not ruled out given the model degeneracy and observational uncertainties (see Sect. 3.2.1). Without an AGN, the SED fitting requires Tdust ≳ 110 K. This value significantly exceeds the typical Tdust ∼ 40 K observed in REBELS galaxies at similar redshifts (Sommovigo et al. 2022), and may indicate additional dust heating mechanisms such as AGN activity. In contrast, including an AGN component (bottom panels) allows acceptable fits with Tdust as low as ∼40–60 K, similar to AGNs and/or quasar host galaxies at z > 4 (∼40 − 100 K; e.g., Walter et al. 2022; Tsukui et al. 2023; Tripodi et al. 2023; Decarli et al. 2023), supporting the presence of an AGN in ID9094. |
| In the text | |
|
Fig. 5. [C II] luminosity as a function of SFR, providing the second hint of an AGN scenario in this work. ID9094 is shown with 3σ upper limits on L[C II] (L[C II] < 1.7 × 10⁸ L⊙) in red and blue arrows, representing cases with (fixed Tdust = 60 K) and without (fixed Tdust = 110 K) an AGN component, respectively. We note that results for Tdust = 40 K with an AGN component are not shown here, as they yield similar or even better agreement with the relation (see Sect. 3.2.2). The blue square indicates the expected L[C II] location of ID9094 if it is a star-forming galaxy without an AGN. Solid gray and black lines, along with their shaded regions, represent the L[C II]–SFR relations and 1σ uncertainties for low-redshift galaxies (De Looze et al. 2014) and high-redshift ALPINE galaxies (z ∼ 4 − 6; Schaerer et al. 2020), respectively. The dashed orange line shows the relation for low-z composite galaxies and AGNs (De Looze et al. 2014). Previous observations of z > 6 galaxies are plotted as gray points or downward triangles, which represent 3σ upper limits (Harikane et al. 2020; Schouws et al. 2023; Fudamoto et al. 2024). |
| In the text | |
|
Fig. A.1. Similar to Fig. 4 but for ID2756. The 3σ upper limit at 1.3 mm is not sufficiently deep to rule out the low Tdust solution, nor to rule out the scenario without an AGN. Deeper FIR/submillimeter observations, at least similar to those for ID9094 (rms level ∼30.4 μJy beam−1 at 1.3 mm), are needed. |
| In the text | |
Current usage metrics show cumulative count of Article Views (full-text article views including HTML views, PDF and ePub downloads, according to the available data) and Abstracts Views on Vision4Press platform.
Data correspond to usage on the plateform after 2015. The current usage metrics is available 48-96 hours after online publication and is updated daily on week days.
Initial download of the metrics may take a while.