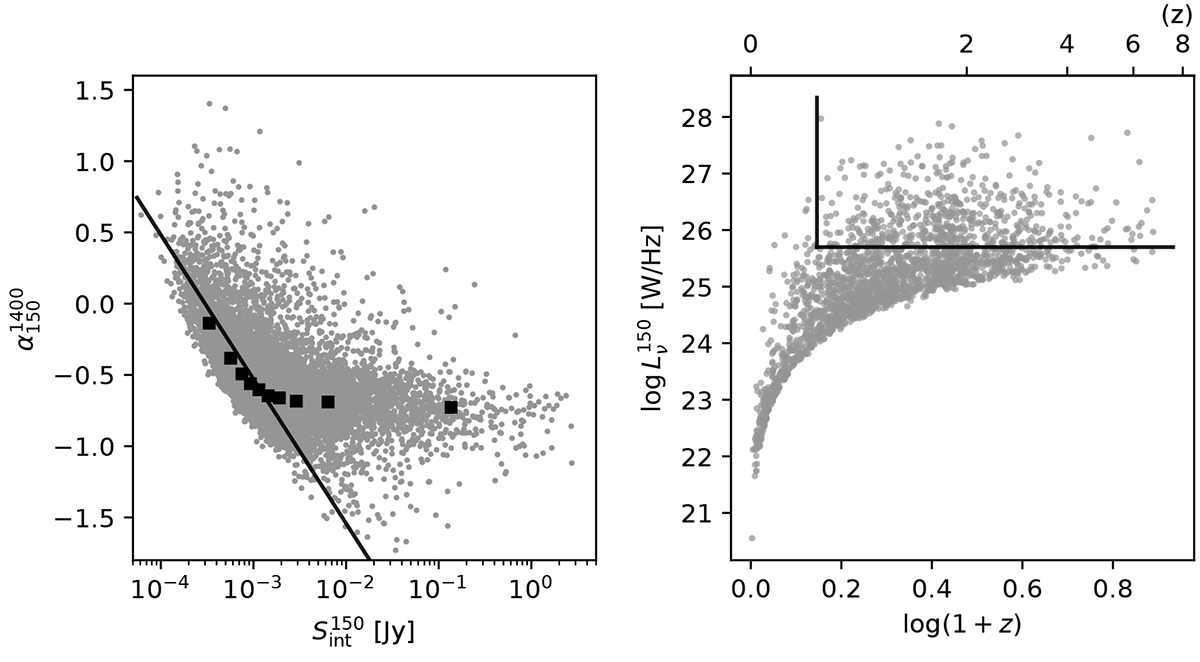
Fig. 3.
Download original image
Left: Spectral index against the LOFAR integrated flux density for all common Apertif and LOFAR sources. The markers show the median spectral index in a given flux density interval. The solid line indicates a lower limit calculated for the Apertif completeness level of 0.3 mJy (Sect. 4.1). Right: Luminosity against redshift for the main sample. The solid lines indicate a Malmquist bias-free region (Sect. 4.2).
Current usage metrics show cumulative count of Article Views (full-text article views including HTML views, PDF and ePub downloads, according to the available data) and Abstracts Views on Vision4Press platform.
Data correspond to usage on the plateform after 2015. The current usage metrics is available 48-96 hours after online publication and is updated daily on week days.
Initial download of the metrics may take a while.