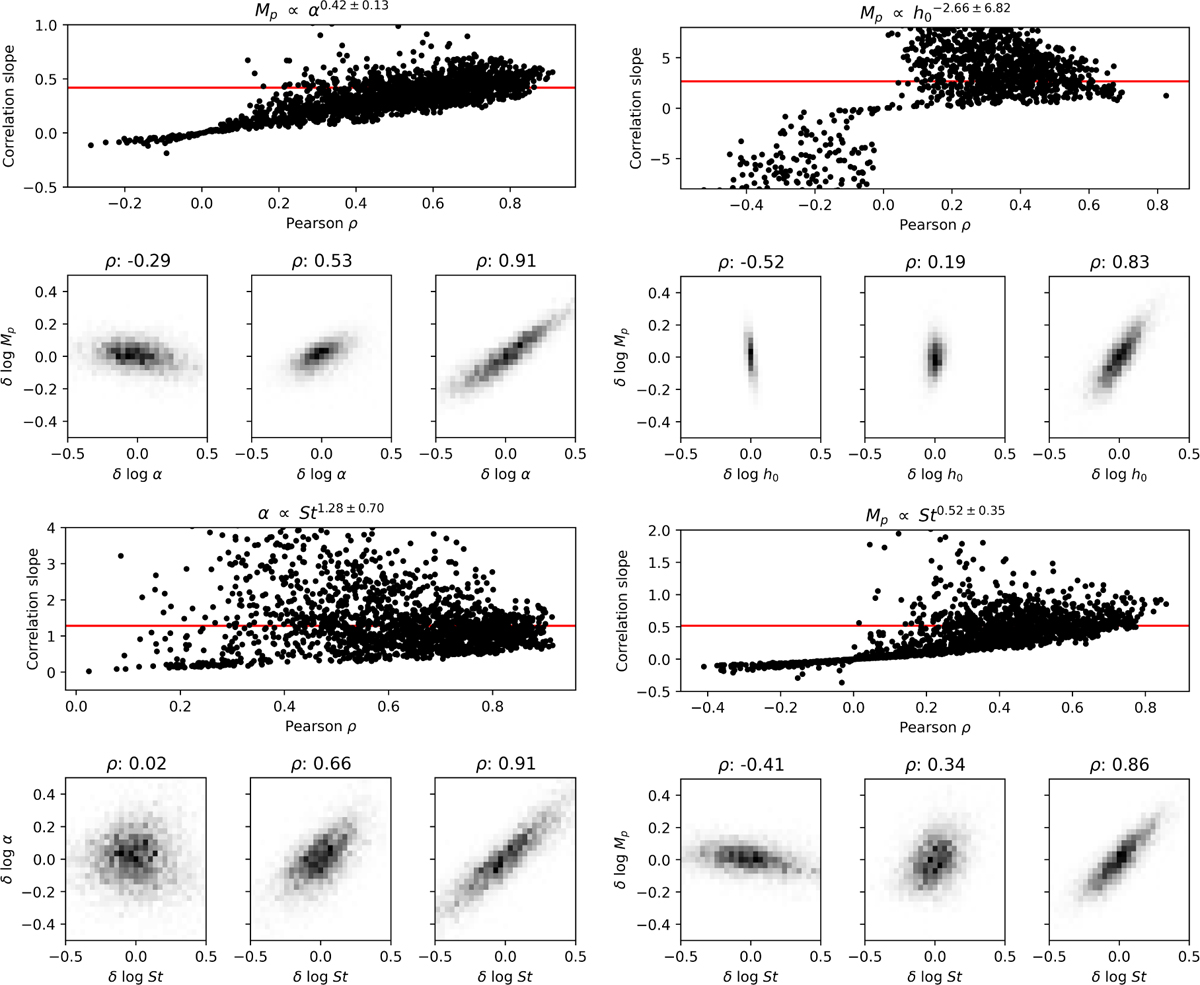
Fig. 18
Download original image
Degeneracies between pairs of properties highlighted by the inferred posteriors on the test set. For each simulation, these plots show the slope of the major axis of the 2D Gaussian that best fits the inferred posterior as a function of the Pearson correlation coefficients. Higher correlation coefficients correspond to sharper distributions towards the major axis of the Gaussian ellipses, as shown by the exemplificative examples plotted. As indicated by the plot titles, the inferred slopes suggest possible degeneracies between pairs of properties in forming the observed substructures. The red lines indicate the weighted average slope, calculated using the Pearson coefficients as weights.
Current usage metrics show cumulative count of Article Views (full-text article views including HTML views, PDF and ePub downloads, according to the available data) and Abstracts Views on Vision4Press platform.
Data correspond to usage on the plateform after 2015. The current usage metrics is available 48-96 hours after online publication and is updated daily on week days.
Initial download of the metrics may take a while.