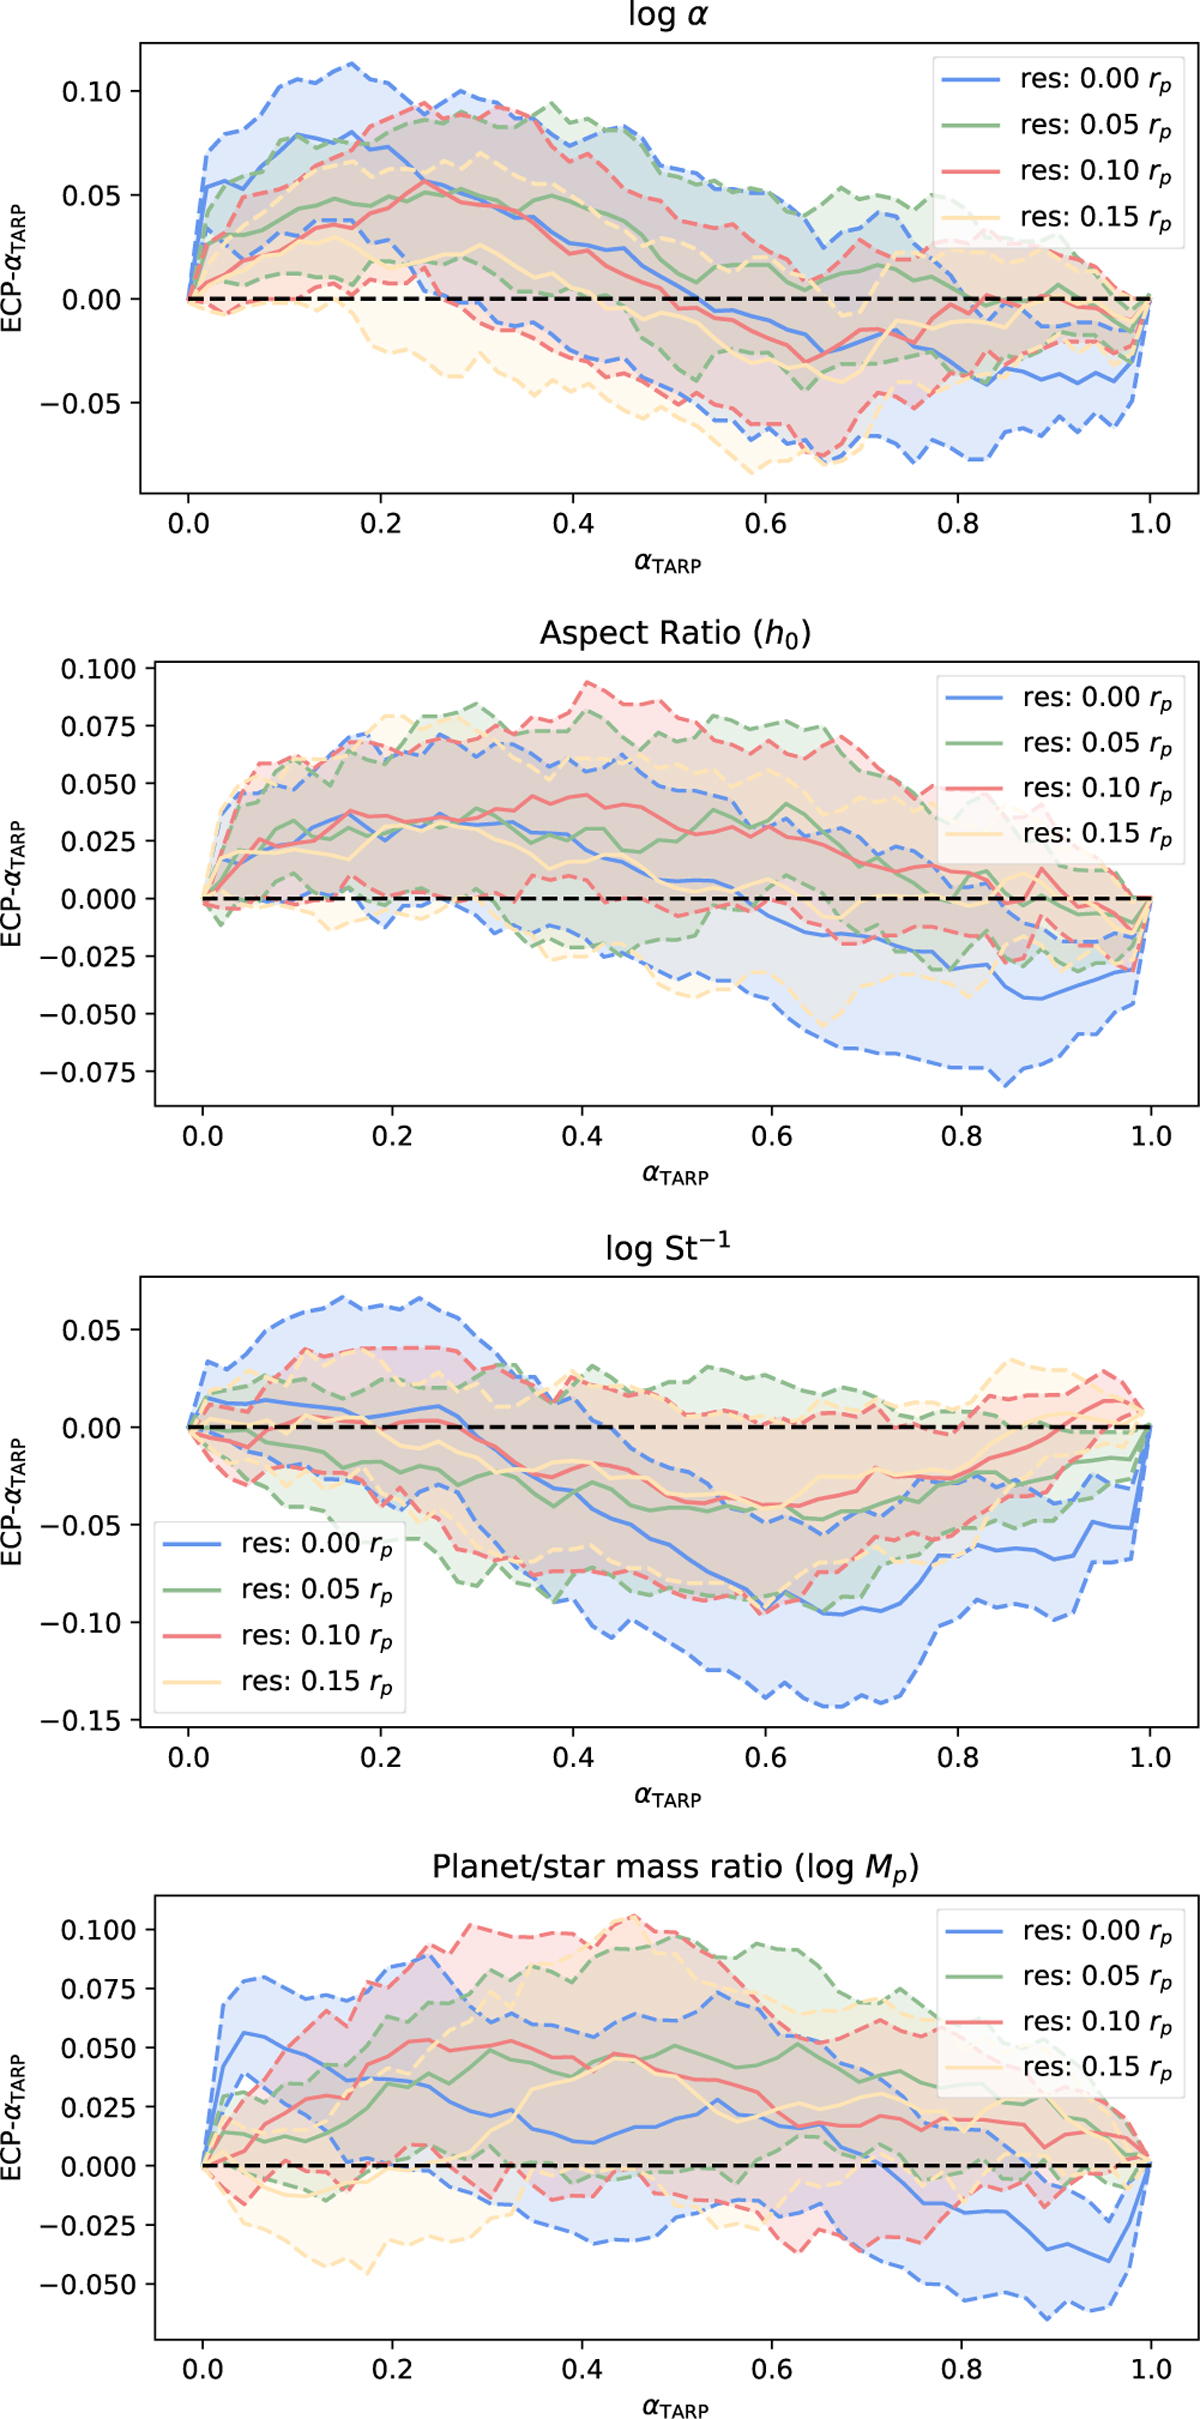
Fig. D.1
Download original image
Results of TARP tests performed for each target property on the marginalised distributions over the other parameters. The different colours refer to the results obtained on synthetic observations convolved with different beam sizes. The dashed black lines mark the target curves that would be obtained if the inferred posteriors were perfectly accurate.
Current usage metrics show cumulative count of Article Views (full-text article views including HTML views, PDF and ePub downloads, according to the available data) and Abstracts Views on Vision4Press platform.
Data correspond to usage on the plateform after 2015. The current usage metrics is available 48-96 hours after online publication and is updated daily on week days.
Initial download of the metrics may take a while.