Open Access
Fig. 3
Download original image
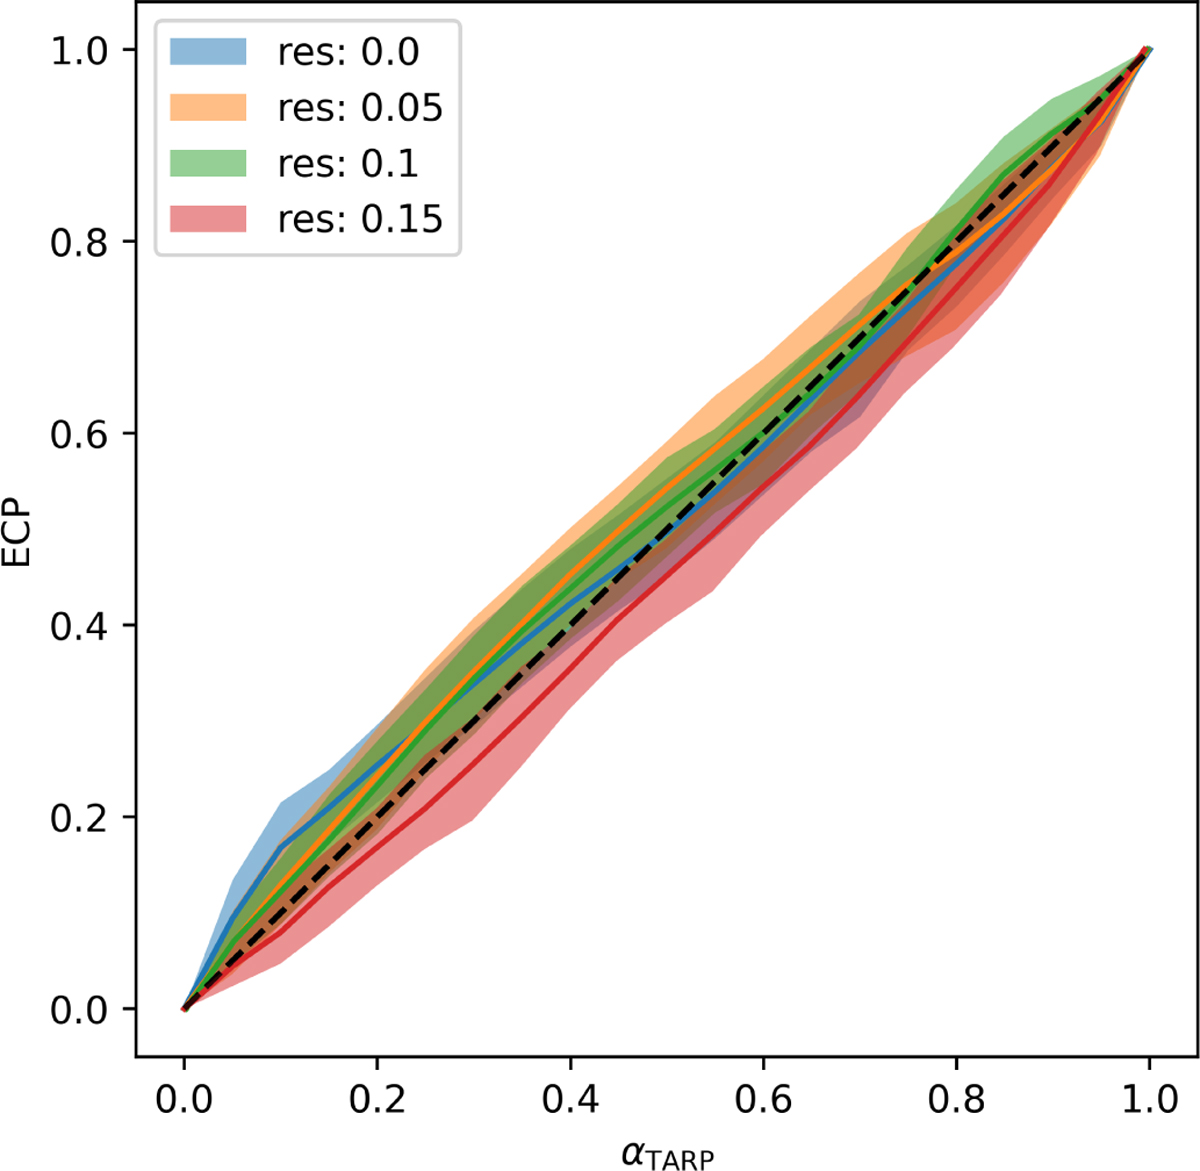
TARP curves computed on the test set using the full pipeline, with input images convolved by Gaussian beams of varying sizes. Shaded areas indicate the uncertainty of the curves, estimated by bootstrapping the test set.
Current usage metrics show cumulative count of Article Views (full-text article views including HTML views, PDF and ePub downloads, according to the available data) and Abstracts Views on Vision4Press platform.
Data correspond to usage on the plateform after 2015. The current usage metrics is available 48-96 hours after online publication and is updated daily on week days.
Initial download of the metrics may take a while.