Open Access
Fig. 4
Download original image
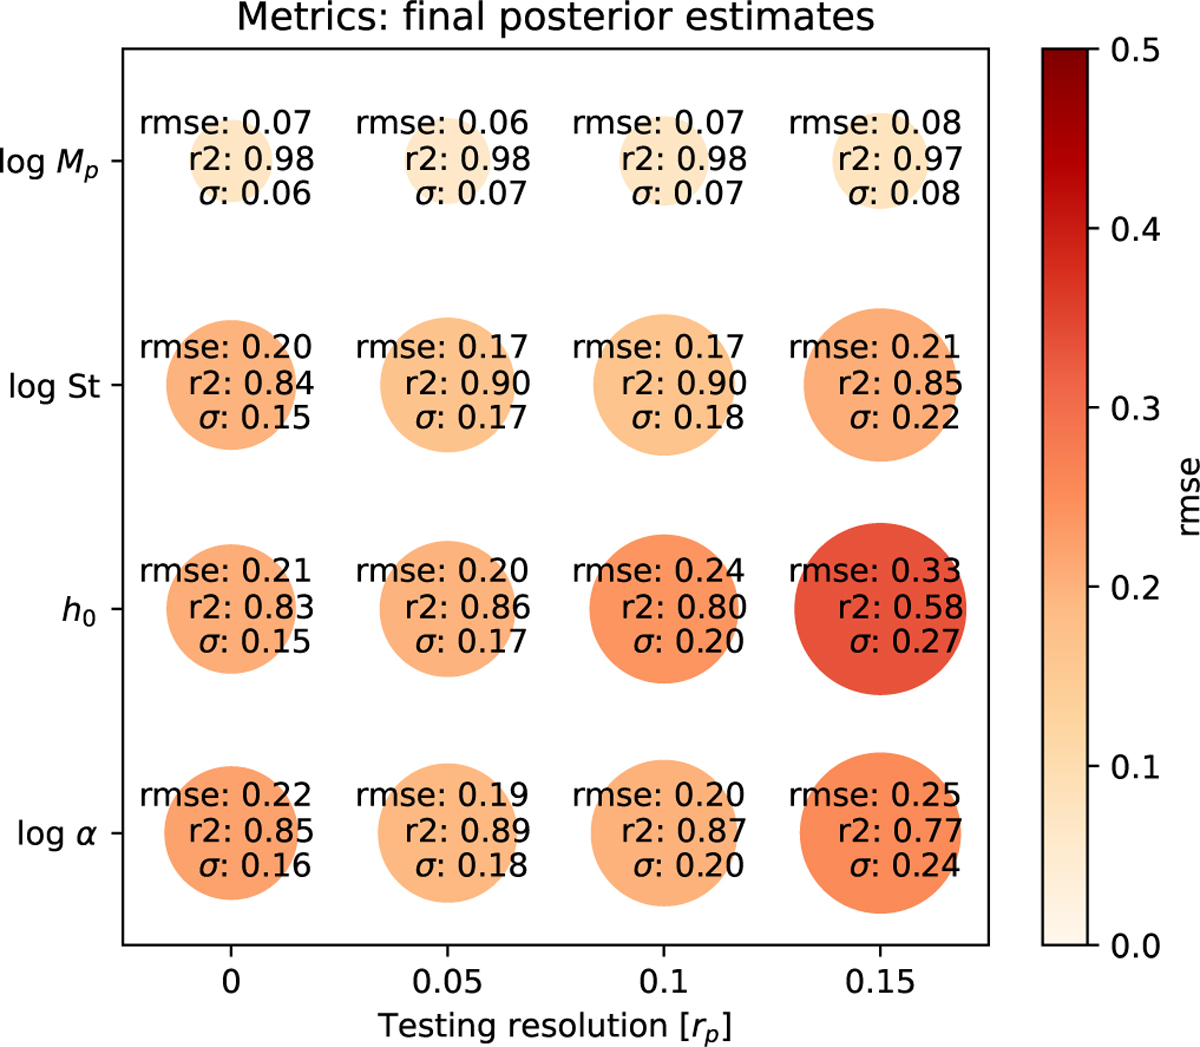
Metrics computed on the test set for the four inferred parameters and at varying resolution of the input images. The RMSE and r2-score are computed using the median of the inferred distributions as best estimates. The σ represents the mean standard deviation of the inferred distributions.
Current usage metrics show cumulative count of Article Views (full-text article views including HTML views, PDF and ePub downloads, according to the available data) and Abstracts Views on Vision4Press platform.
Data correspond to usage on the plateform after 2015. The current usage metrics is available 48-96 hours after online publication and is updated daily on week days.
Initial download of the metrics may take a while.