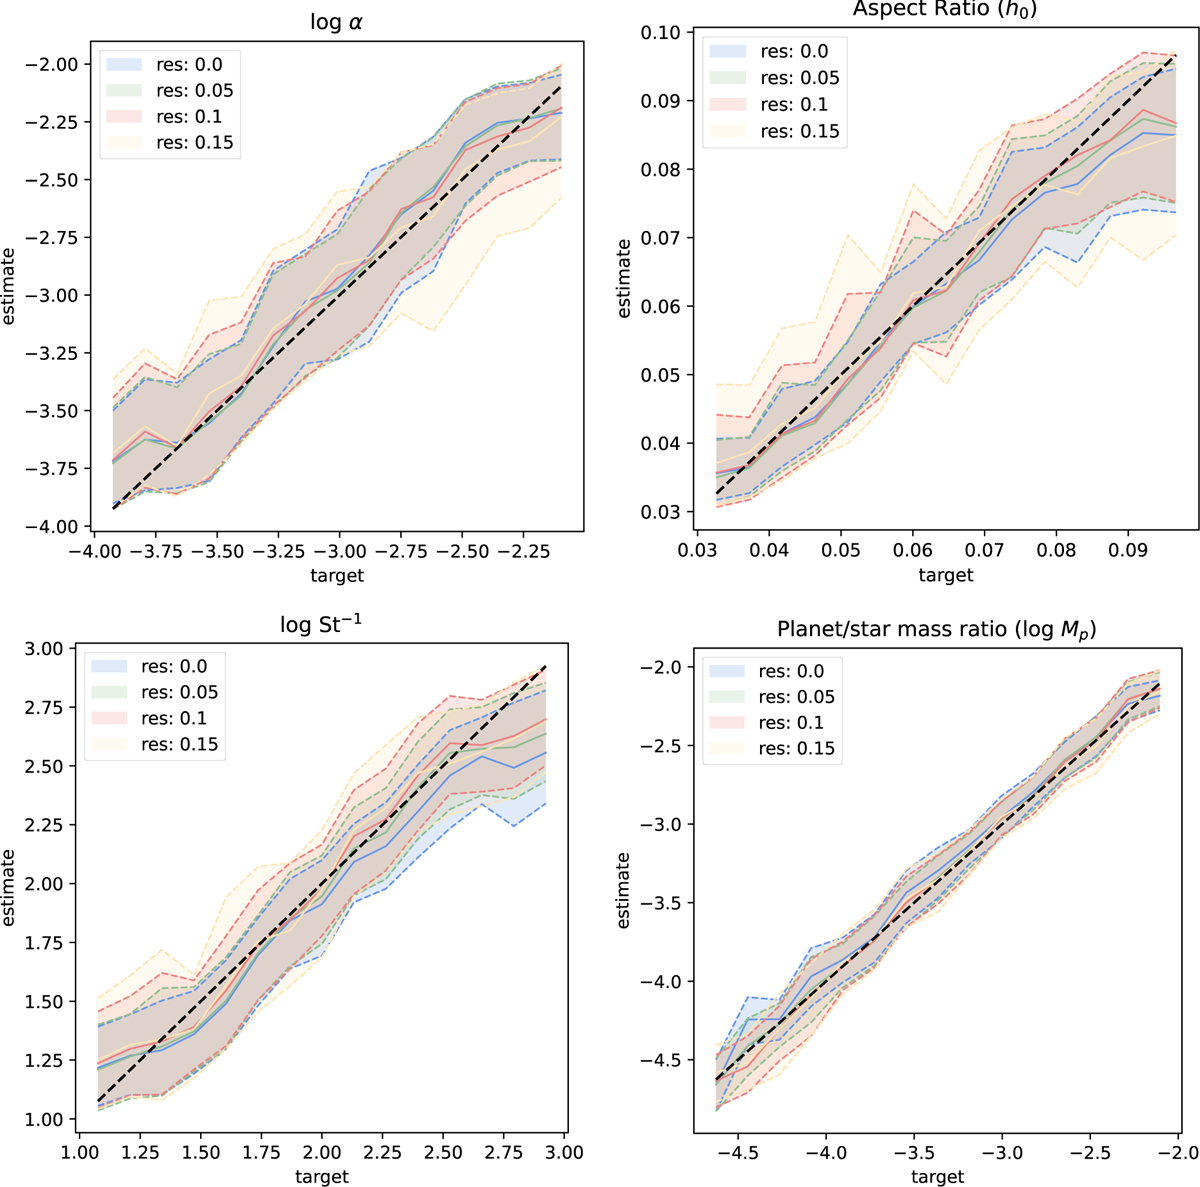
Fig. 5
Download original image
Results on the test set for each inferred property. For each targeted disc or planet property, the plots show the correlation between DBNets2.0 estimates and target values by plotting the median of the inferred distributions along with the region between the 16th and 84th percentiles. Different colours correspond to results obtained from synthetic images at varying resolutions.
Current usage metrics show cumulative count of Article Views (full-text article views including HTML views, PDF and ePub downloads, according to the available data) and Abstracts Views on Vision4Press platform.
Data correspond to usage on the plateform after 2015. The current usage metrics is available 48-96 hours after online publication and is updated daily on week days.
Initial download of the metrics may take a while.