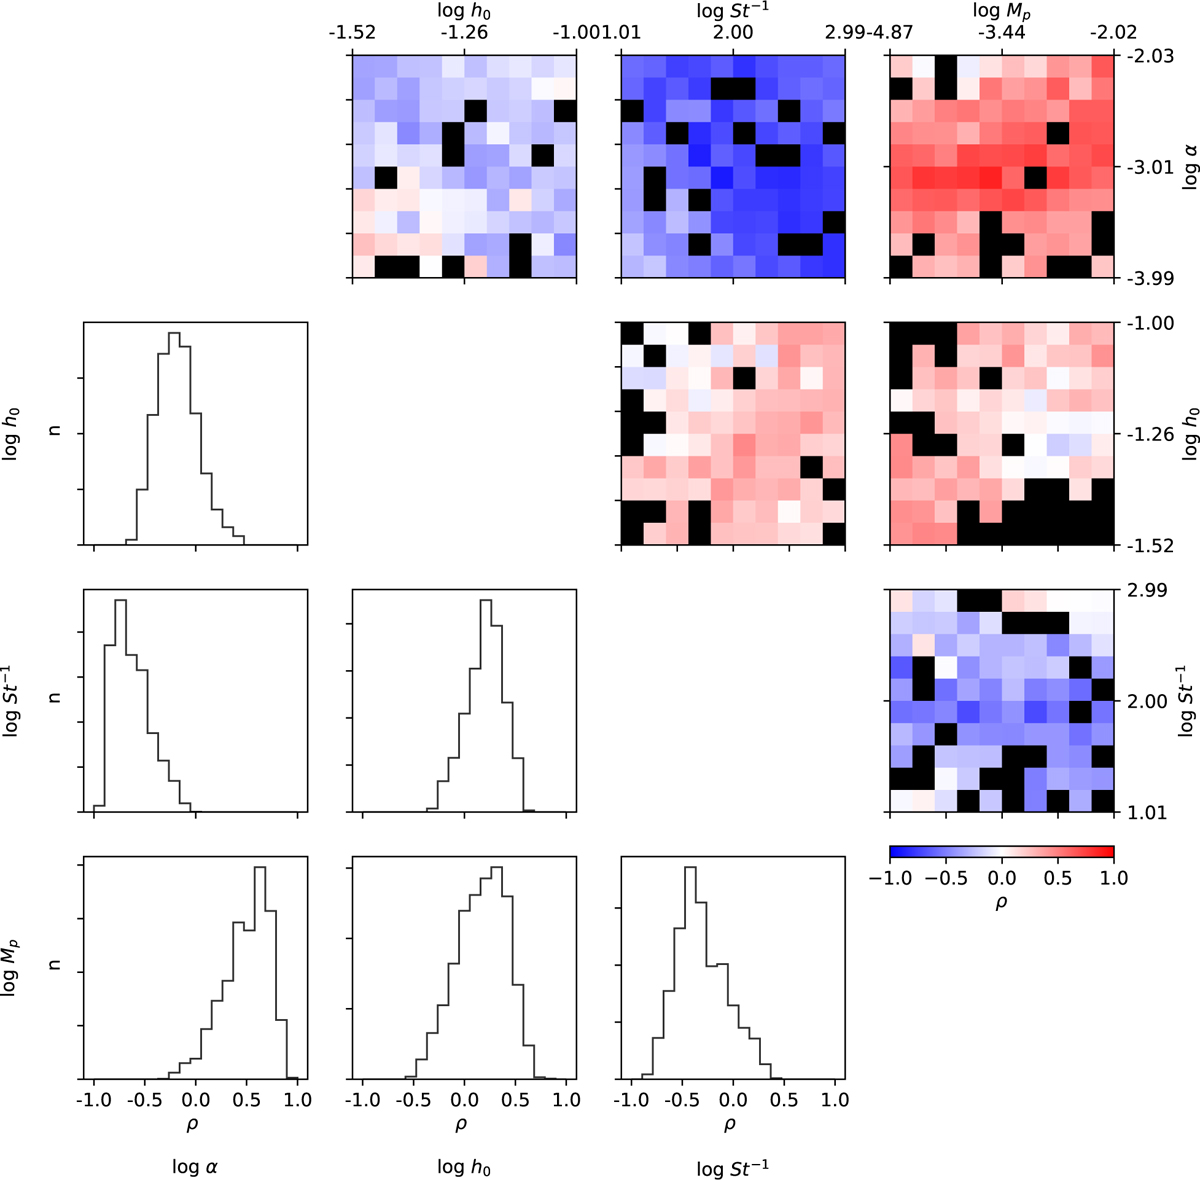
Fig. 6
Download original image
Pearson correlation coefficients between pairs of inferred properties, computed for each element of the test set using 5000 samples from the inferred posterior. The bottom-left panels shows, for each pair of target properties, the distribution of values of the relative Pearson correlation coefficients over the entire test set. The top-right corner displays the same coefficients as a function of the two parameters considered. Bins in the 2D histograms with no data are shown in black.
Current usage metrics show cumulative count of Article Views (full-text article views including HTML views, PDF and ePub downloads, according to the available data) and Abstracts Views on Vision4Press platform.
Data correspond to usage on the plateform after 2015. The current usage metrics is available 48-96 hours after online publication and is updated daily on week days.
Initial download of the metrics may take a while.