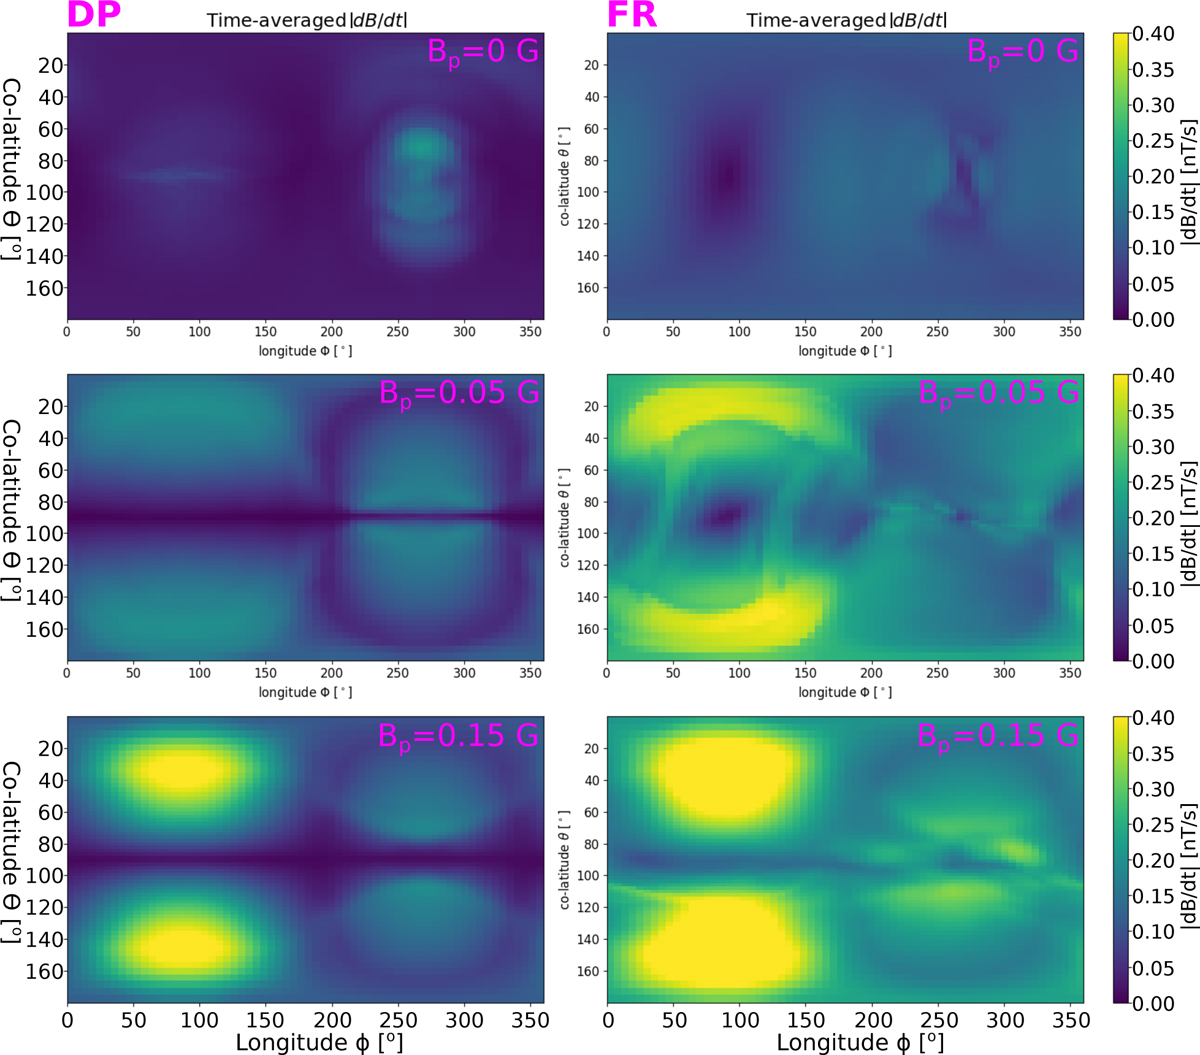
Fig. 10
Download original image
Maps of time-averaged magnetic variability, dB/dt (nT/s), of the radial magnetic field component obtained directly above the planetary surface. Co-latitude and longitude are shown on the Y and X axes, respectively. Upstream direction is at longitude below 180 degrees. Model results are shown in the left column for the DP and in the right column for the FR case. We show maps for Bp = 0 (top), 0.05 (middle) and 0.15 G (bottom).
Current usage metrics show cumulative count of Article Views (full-text article views including HTML views, PDF and ePub downloads, according to the available data) and Abstracts Views on Vision4Press platform.
Data correspond to usage on the plateform after 2015. The current usage metrics is available 48-96 hours after online publication and is updated daily on week days.
Initial download of the metrics may take a while.