Open Access
Fig. 12
Download original image
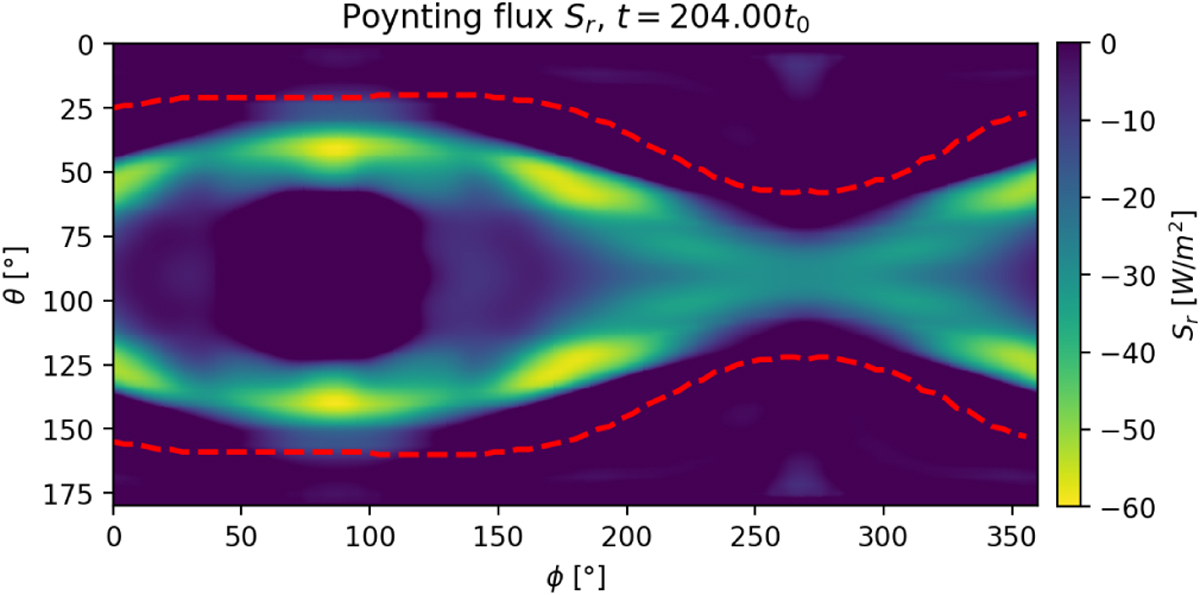
Open-closed field line boundary (red lines) plotted on top of an inward Poynting flux, Sin, map for Trappist-1e, Bp = 0.21 G, DP model. As an example, the map is shown during the CME sheath crossing, but the boundary remains almost constant over the entire simulation period for DP as well as FR simulations.
Current usage metrics show cumulative count of Article Views (full-text article views including HTML views, PDF and ePub downloads, according to the available data) and Abstracts Views on Vision4Press platform.
Data correspond to usage on the plateform after 2015. The current usage metrics is available 48-96 hours after online publication and is updated daily on week days.
Initial download of the metrics may take a while.