Fig. 14
Download original image
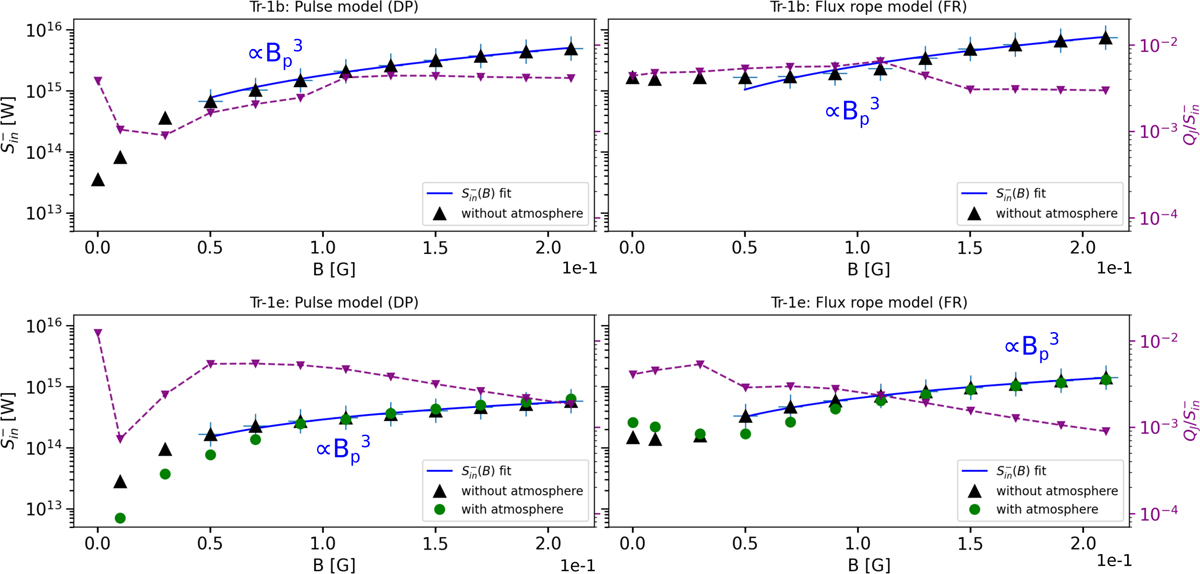
Time-averaged inward Poynting fluxes ![]() in Watts as a function of planetary magnetic field flux density, Bp, in G. DP results are on the left, FR results are on the right. The top row shows Trappist-1b, the bottom row Trappist-1e. Black triangles denote
in Watts as a function of planetary magnetic field flux density, Bp, in G. DP results are on the left, FR results are on the right. The top row shows Trappist-1b, the bottom row Trappist-1e. Black triangles denote ![]() . Purple downward triangles denote the ratio of Ohmic heating to inward Poynting flux
. Purple downward triangles denote the ratio of Ohmic heating to inward Poynting flux ![]() (right y-axis). The blue solid lines are fits to the Poynting flux data. We excluded the cases where the upstream magnetopause is pushed to the planetary surface during the CME event (Bp < 0.5 G). Green circles show
(right y-axis). The blue solid lines are fits to the Poynting flux data. We excluded the cases where the upstream magnetopause is pushed to the planetary surface during the CME event (Bp < 0.5 G). Green circles show ![]() with an atmosphere present.
with an atmosphere present.
Current usage metrics show cumulative count of Article Views (full-text article views including HTML views, PDF and ePub downloads, according to the available data) and Abstracts Views on Vision4Press platform.
Data correspond to usage on the plateform after 2015. The current usage metrics is available 48-96 hours after online publication and is updated daily on week days.
Initial download of the metrics may take a while.