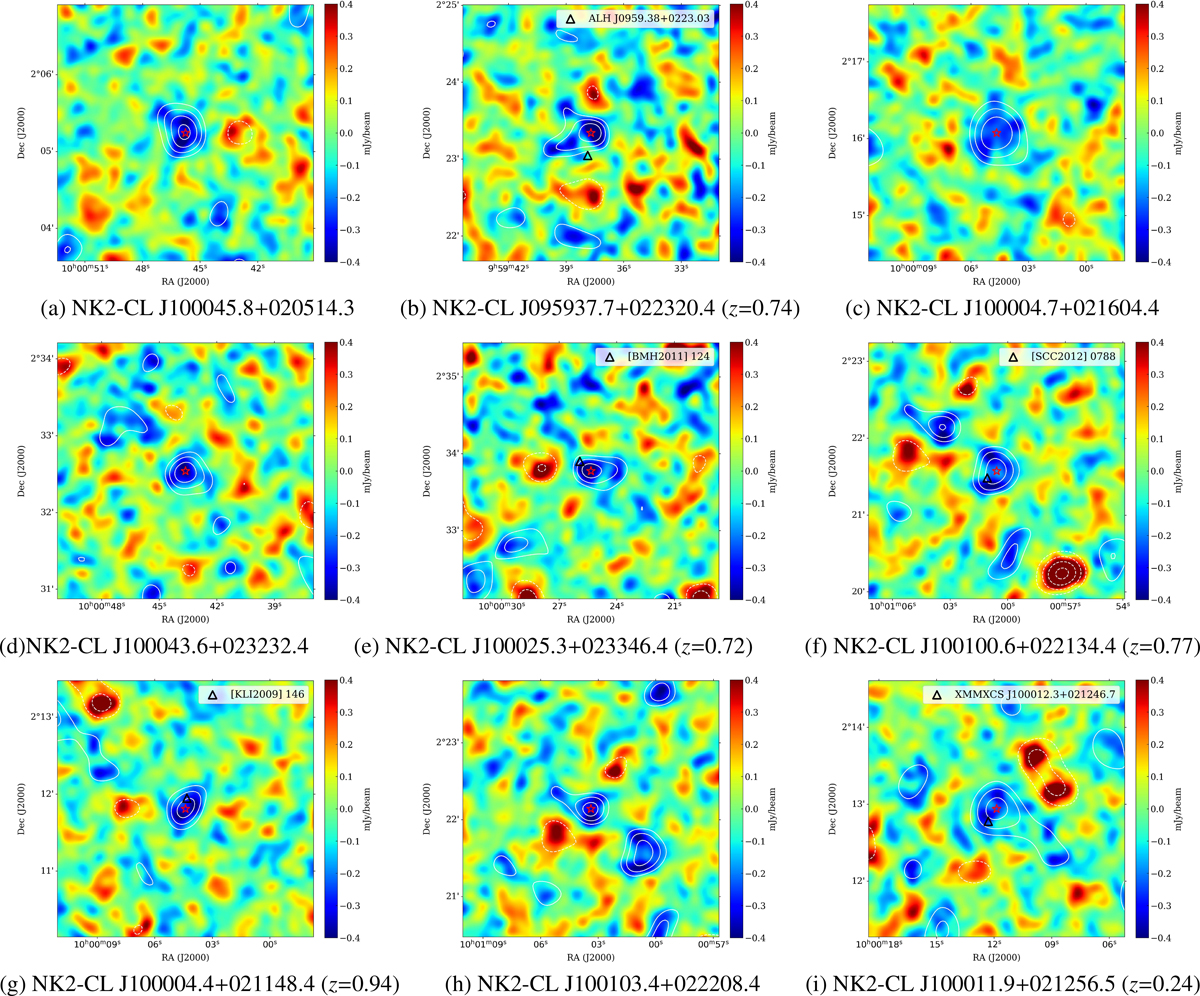
Fig. A.1.
Download original image
200″ × 200″ cutouts of the NIKA2 COSMOS 2 mm map around each cluster candidate. The center of the candidate (red star) shows clear negative signal. Clusters found in the literature are shown as black triangles. For each candidate, we show as white contours the S/N levels in the matched-filtered map where its detection S/N is maximum (see Sect. 3.3). The contours start at ±2σ and are spaced by ±1σ. The maps have been smoothed with a 10″ gaussian kernel for display purposes.
Current usage metrics show cumulative count of Article Views (full-text article views including HTML views, PDF and ePub downloads, according to the available data) and Abstracts Views on Vision4Press platform.
Data correspond to usage on the plateform after 2015. The current usage metrics is available 48-96 hours after online publication and is updated daily on week days.
Initial download of the metrics may take a while.