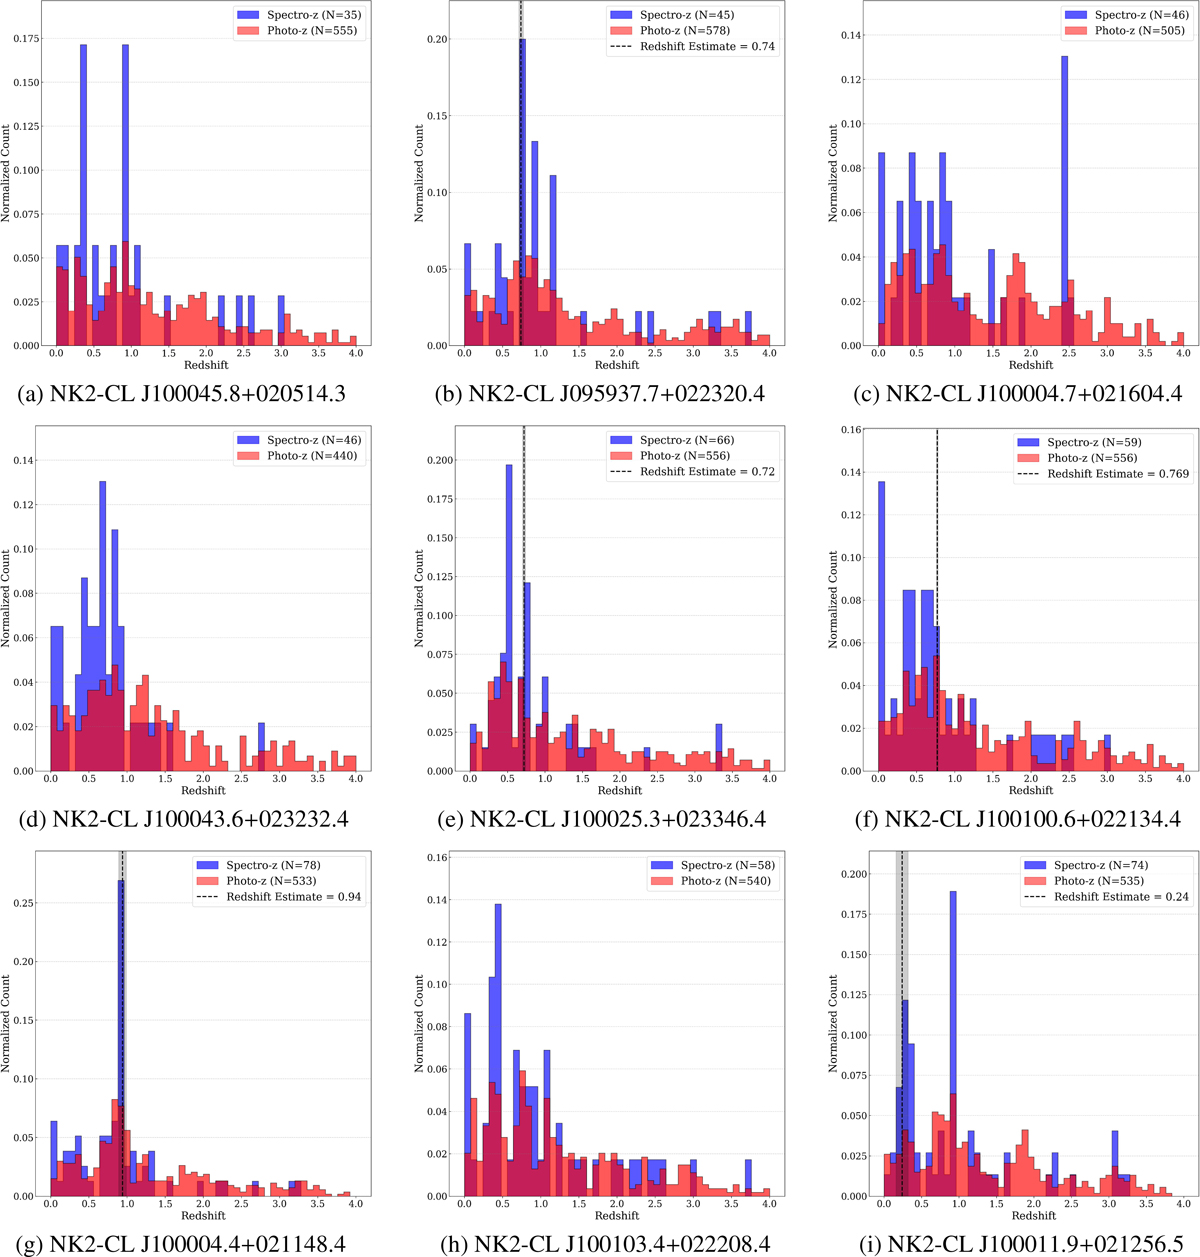
Fig. B.1.
Download original image
Normalized spectroscopic (blue) and photometric (red) redshift counts within a 1 arcmin radius around each cluster candidate. The total number of galaxies, N, within this radius is indicated in the legend of the figure for each redshift type. The number of galaxies per redshift bin is obtained by multiplying N by the normalized counts. If the NIKA2 cluster candidate has a redshift estimate (see Table 1), its redshift is represented by a black dashed line.
Current usage metrics show cumulative count of Article Views (full-text article views including HTML views, PDF and ePub downloads, according to the available data) and Abstracts Views on Vision4Press platform.
Data correspond to usage on the plateform after 2015. The current usage metrics is available 48-96 hours after online publication and is updated daily on week days.
Initial download of the metrics may take a while.