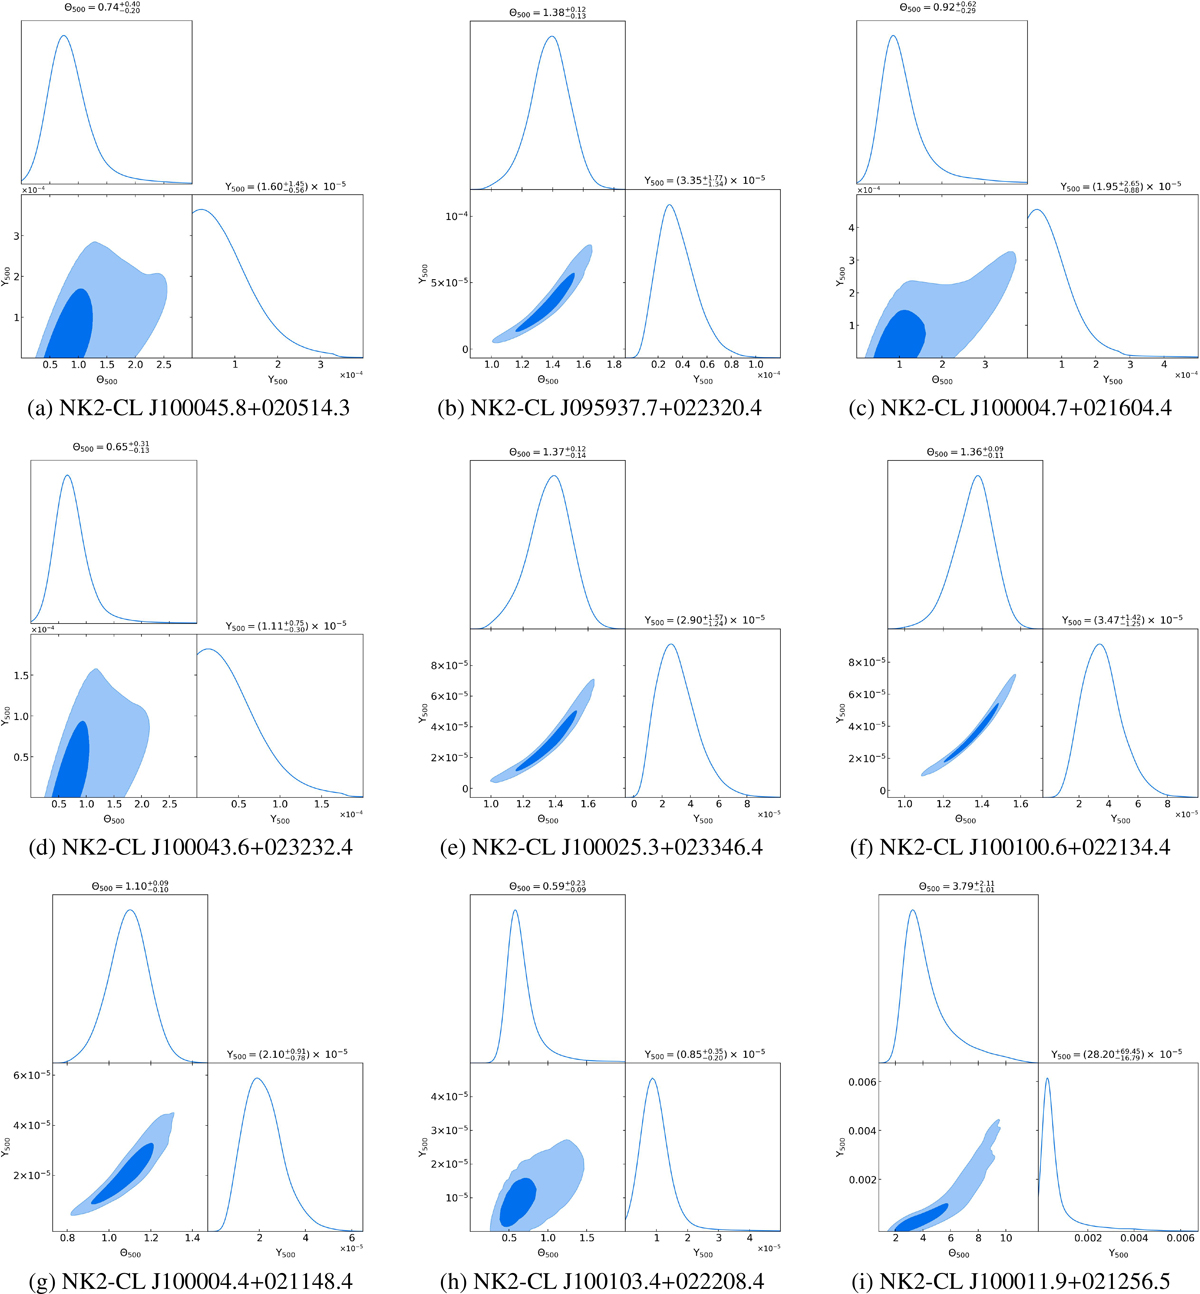
Fig. C.1.
Download original image
Corner plot of the θ500 − Y500 posterior maximum likelihood distribution for each of the cluster candidate. A more detailed description of the fitting procedure can be found in Sect. 6.1. The 68% confidence values and uncertainties are given in the figure. We see that the posterior distributions are much better constrained for cluster candidates with a redshift estimate, as expected from the tighter redshift prior.
Current usage metrics show cumulative count of Article Views (full-text article views including HTML views, PDF and ePub downloads, according to the available data) and Abstracts Views on Vision4Press platform.
Data correspond to usage on the plateform after 2015. The current usage metrics is available 48-96 hours after online publication and is updated daily on week days.
Initial download of the metrics may take a while.