Open Access
Fig. 3.
Download original image
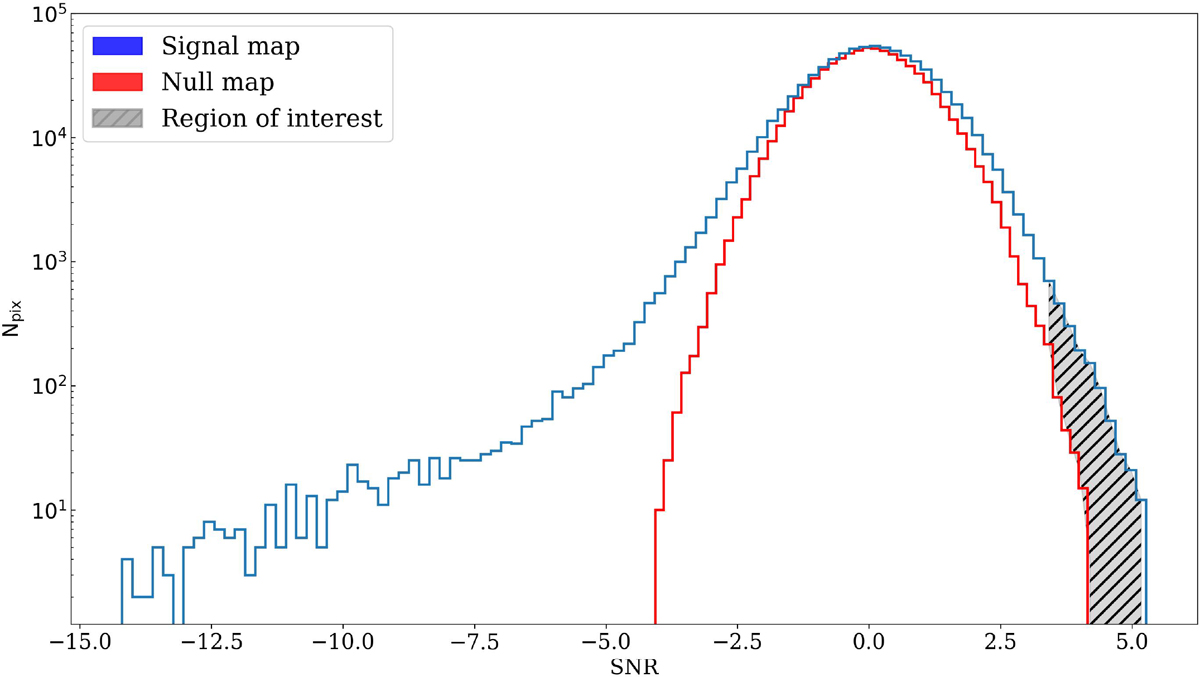
Pixel negative S/N distribution in the match-filtered N2CLS 2 mm signal map (blue) and null map (red). The high negative S/N tail is due to point sources. The hatched gray area shows a small positive S/N tail up to S/N ∼ 5, indicating strong negative signal in the 2 mm signal map, as expected for the SZ sources.
Current usage metrics show cumulative count of Article Views (full-text article views including HTML views, PDF and ePub downloads, according to the available data) and Abstracts Views on Vision4Press platform.
Data correspond to usage on the plateform after 2015. The current usage metrics is available 48-96 hours after online publication and is updated daily on week days.
Initial download of the metrics may take a while.