Fig. 14
Download original image
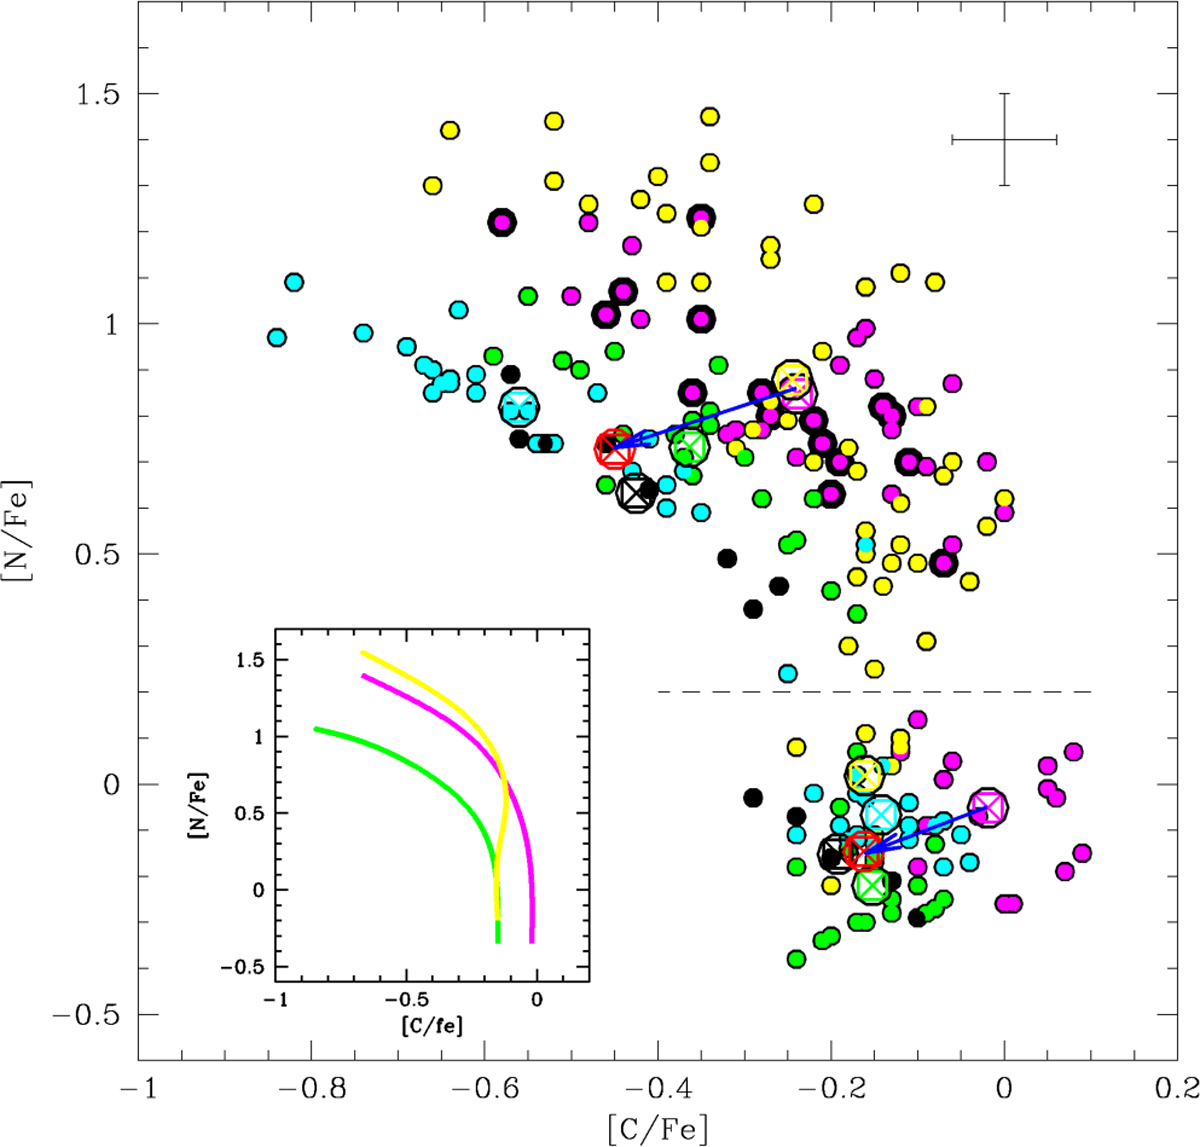
Final [N/Fe] vs [C/Fe] anticorrelation we obtained for our targets. Magenta, yellow, green, cyan, and black symbols represents MS, SGB, RGB, HB, and AGB targets, respectively. Mean values for FG and SG stars are indicated with crosses surrounded by black circles. The horizontal line at [N/Fe]=+0.20 divides FG from SG targets. The inset shown the mean ridge lines for the N versus C anticorrelations of MS (magenta), SGB (yellow) and evolved (green) targets. Error-bar shows the typical errors (see text for more details).
Current usage metrics show cumulative count of Article Views (full-text article views including HTML views, PDF and ePub downloads, according to the available data) and Abstracts Views on Vision4Press platform.
Data correspond to usage on the plateform after 2015. The current usage metrics is available 48-96 hours after online publication and is updated daily on week days.
Initial download of the metrics may take a while.