Fig. 15
Download original image
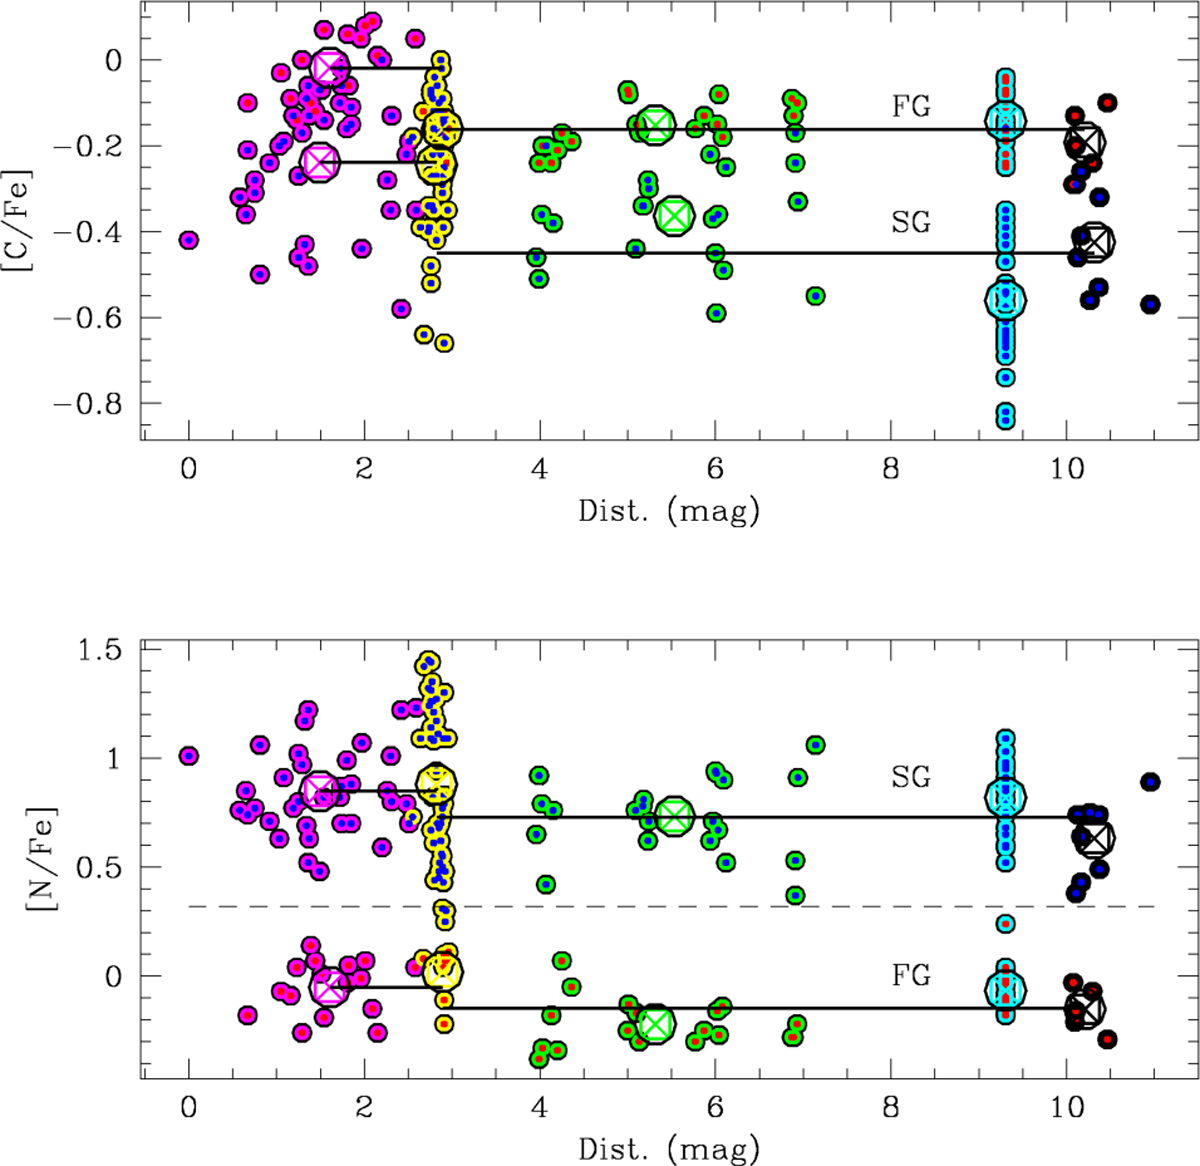
Plots of [C/Fe] versus Dist. (upper panel) and [N/Fe] versus Dist. (lower panel) for our targets. Magenta, yellow, green, cyan, and black symbols represents MS, SGB, RGB, HB, and AGB targets, respectively. The targets have a red or blue circle inside if they belong to the FG or SG respectively. Mean values for FG and SG stars at the different phases are indicated with crosses surrounded by big black circles. The horizontal line at [N/Fe]=+0.20 divides FG from SG targets, while the continuous black lines represent the mean values of unevolved (before the SGB) and evolved (after the SGB) stars (see text for more details).
Current usage metrics show cumulative count of Article Views (full-text article views including HTML views, PDF and ePub downloads, according to the available data) and Abstracts Views on Vision4Press platform.
Data correspond to usage on the plateform after 2015. The current usage metrics is available 48-96 hours after online publication and is updated daily on week days.
Initial download of the metrics may take a while.