Fig. 16
Download original image
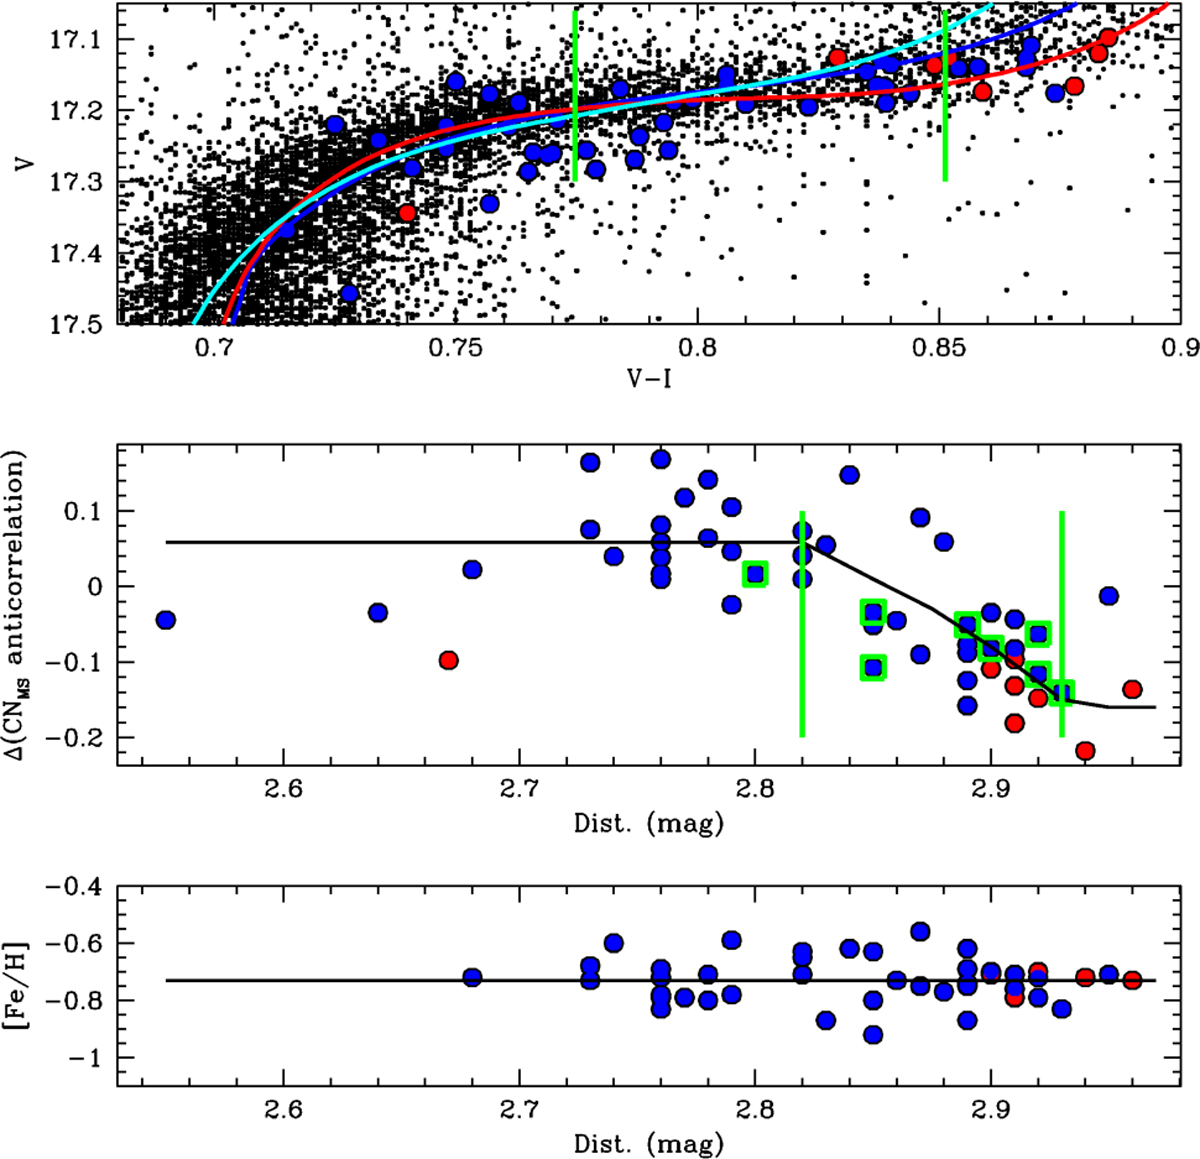
Upper panel: distribution on the CMD of FG (red) and SG (blue) SGB targets. The SGB region where abundance change happens is indicated by the two green lines. Middle panel: abundance variation along the SGB. The y coordinate is the [C/Fe] difference between each target and the point of the MS anticorrelation (the magenta line in the inset of Figure 14) closest to that target. Bottom panel: [Fe/H] as a function of the position along the SGB. See text for more details.
Current usage metrics show cumulative count of Article Views (full-text article views including HTML views, PDF and ePub downloads, according to the available data) and Abstracts Views on Vision4Press platform.
Data correspond to usage on the plateform after 2015. The current usage metrics is available 48-96 hours after online publication and is updated daily on week days.
Initial download of the metrics may take a while.