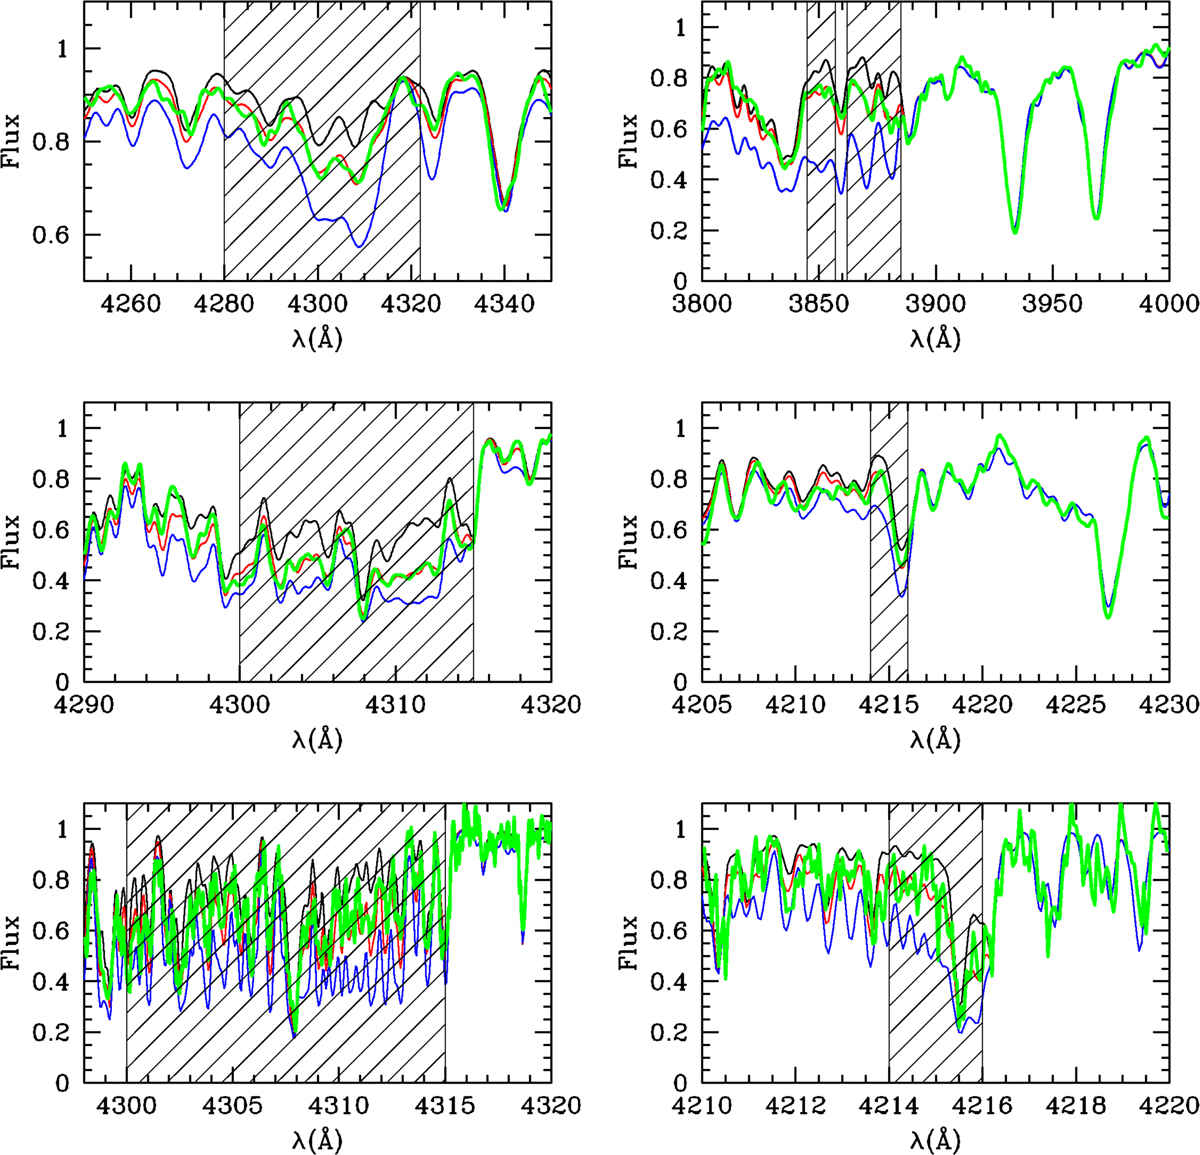
Fig. 3
Download original image
Example of spectrosynthesis. Panels on the left show the synthesis for C while panels on the right show the synthesis for N. The upper row shows the synthesis for the MS target #1_13, the middle row shows synthesis for the HB target #RHB_I_a_40848, and the lower row shows the synthesis for the SGB target N104e_51104. The wavelength range used for the abundance determination is shown as a shaded region. Observed spectra are in green. Red spectra show the best match, while blue and black spectra represent abundance variations of ±0.5 dex for C respectively, while for N we used ±1.0 dex for low resolution spectra of MS and SGB stars (upper panel) and ±0.5 dex for intermediate and high resolution spectra of SGB, RGB, HB and AGB stars (middle and lower panel).
Current usage metrics show cumulative count of Article Views (full-text article views including HTML views, PDF and ePub downloads, according to the available data) and Abstracts Views on Vision4Press platform.
Data correspond to usage on the plateform after 2015. The current usage metrics is available 48-96 hours after online publication and is updated daily on week days.
Initial download of the metrics may take a while.