Fig. 6
Download original image
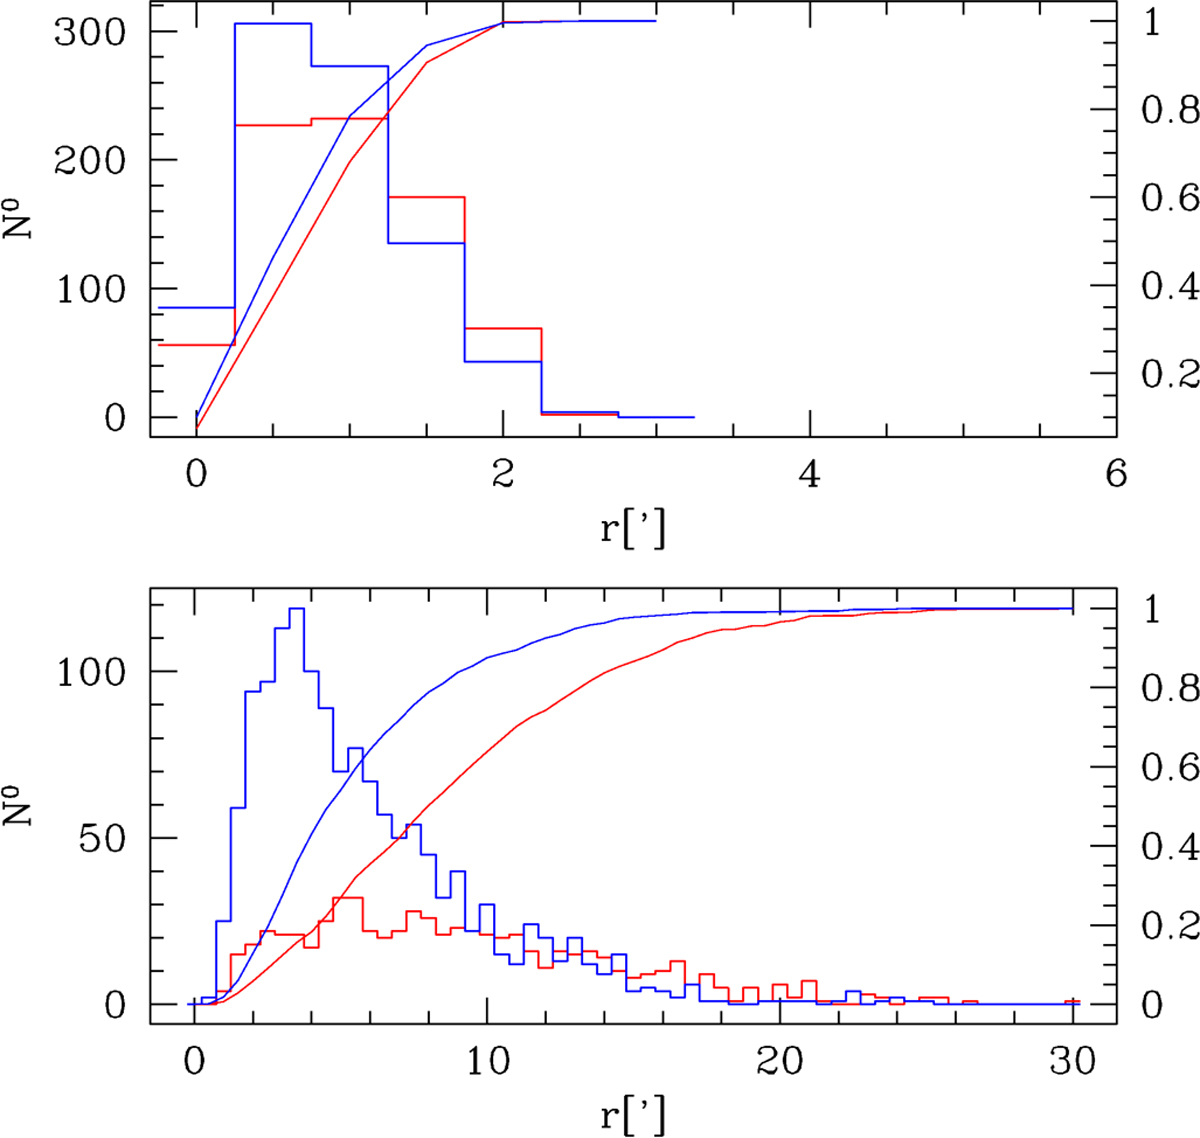
Histogram distribution and cumulative distribution of FG (red) and SG (blue) RGB stars as a function of the radial distance r. Histograms and cumulative curves from r=0′ and r=3′ were obtained from the HST photometry (upper panel), while those from r∼2′ to r=30′ were obtained from the ground-based photometry (lower panel). We note that the x-scale is different for the two panels and that for the upper panel was extended to 6′ in order to improve the visualization.
Current usage metrics show cumulative count of Article Views (full-text article views including HTML views, PDF and ePub downloads, according to the available data) and Abstracts Views on Vision4Press platform.
Data correspond to usage on the plateform after 2015. The current usage metrics is available 48-96 hours after online publication and is updated daily on week days.
Initial download of the metrics may take a while.