Fig. 9
Download original image
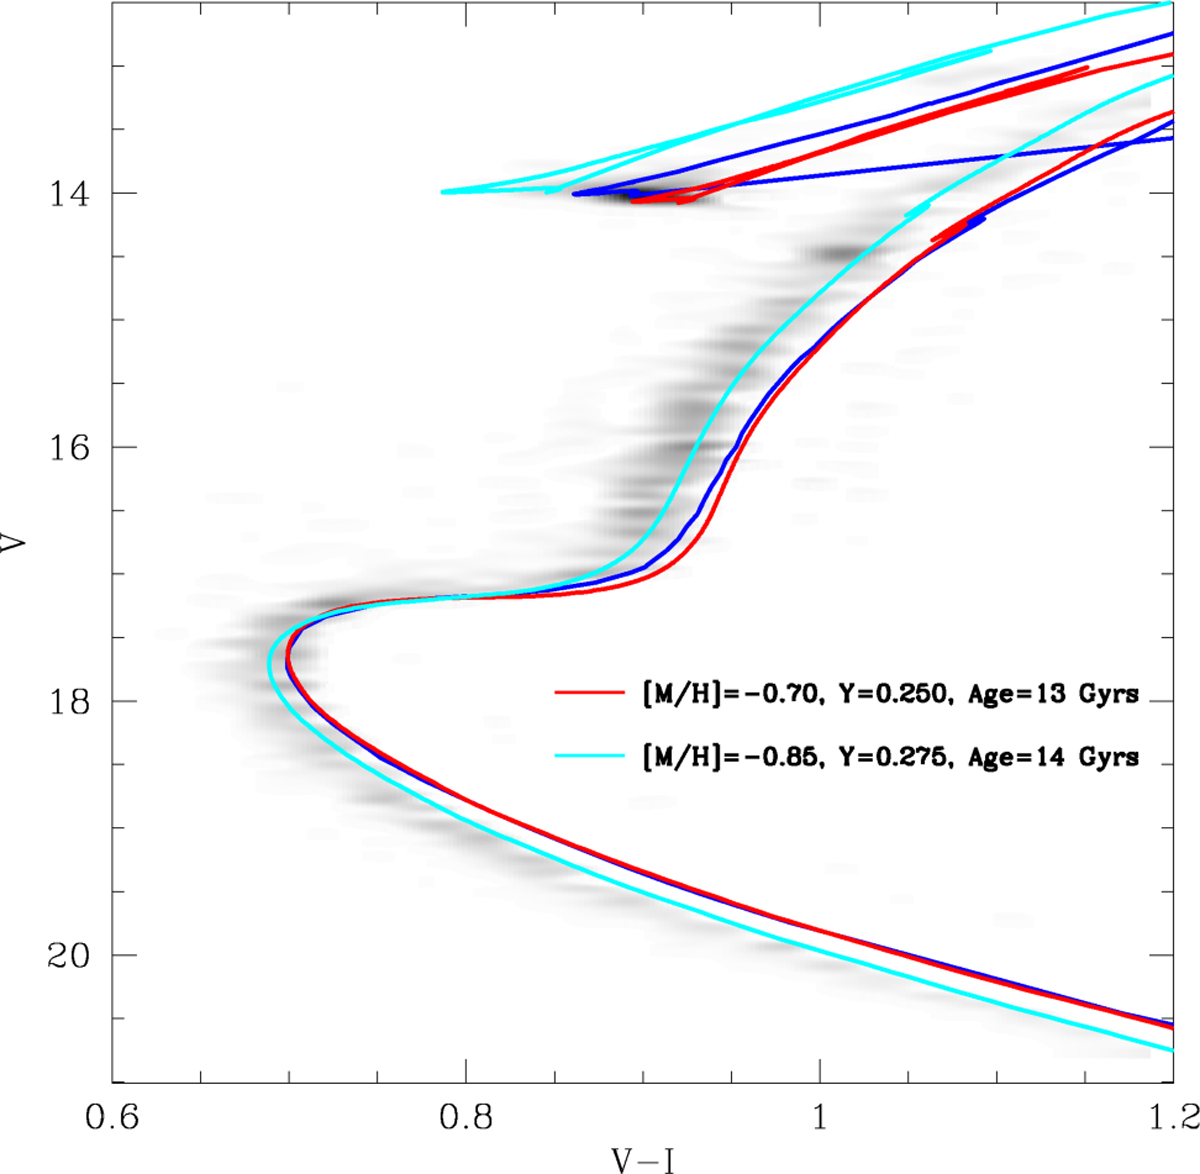
Difference between the Hess diagrams of the full photometry (see Figure 2) and the outer part (r>15′) photometry (see Figure 7). The blue line is the same best fitting isochrone shown in Figure 2, while the red curved is the BASTI isochrone that bast matches the Padova isochrone. Cyan curve is the He-enhanced, [M/H]-poor BASTI isochrone that best reproduce the locus of SG stars. Parameters for the two BASTI isochrones are indicated.
Current usage metrics show cumulative count of Article Views (full-text article views including HTML views, PDF and ePub downloads, according to the available data) and Abstracts Views on Vision4Press platform.
Data correspond to usage on the plateform after 2015. The current usage metrics is available 48-96 hours after online publication and is updated daily on week days.
Initial download of the metrics may take a while.