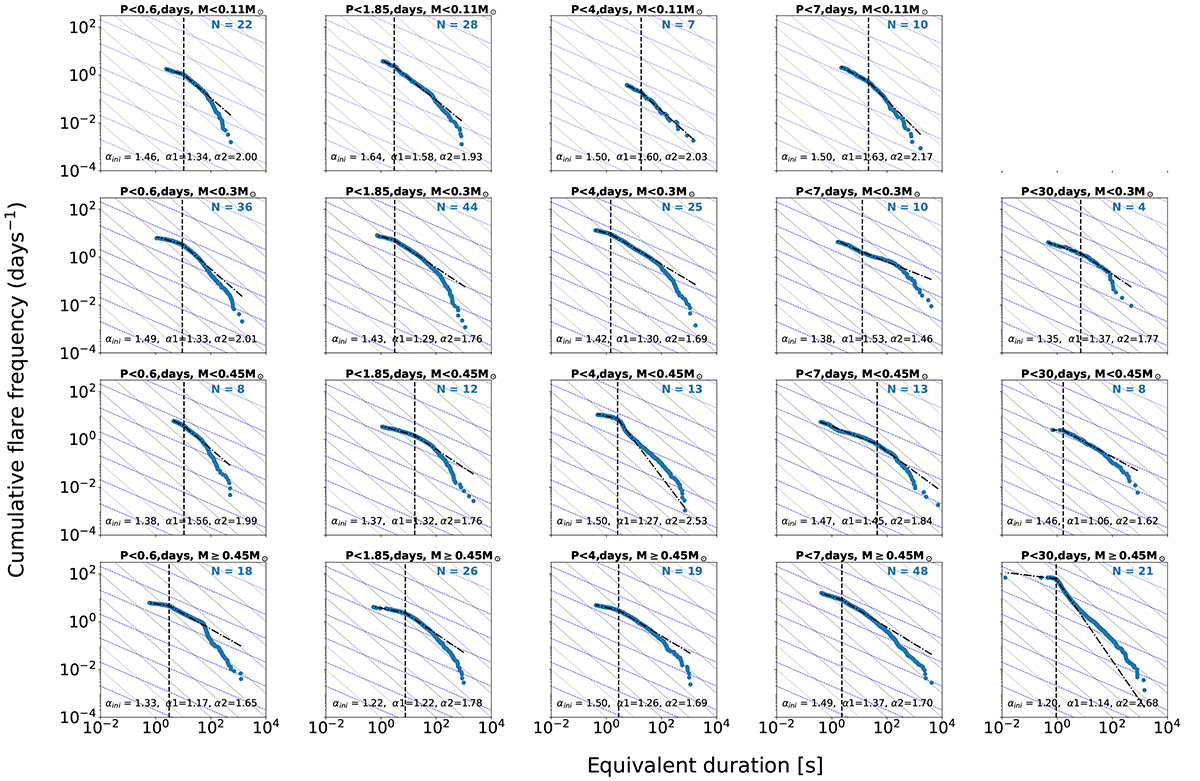
Fig. 4.
Download original image
Cumulative distribution plotted for the mass-period bins for young (age < 800 Myr) stars in the sample. Blue dots represent the bin sub-sample FFD, which combines multiple stars by averaging each portion of the FFD by the number of stars that contribute to it. We first calculated initial guess for slope, α1 ini, and intercept, βini, using MMLE method (Maschberger & Kroupa 2009). The initial guess for α2 ini is fixed at 2.0. Then the broken power law was fitted to the distribution, resulting slopes α1, α2 (black dash-dotted lines) and break points (black dashed lines), if the fit was successful. The grey and blue dashed guides corresponding to power law coefficient α = 2.0 and α = 1.5, respectively, plotted for a range of ED ∈ [10−2, 104] days.
Current usage metrics show cumulative count of Article Views (full-text article views including HTML views, PDF and ePub downloads, according to the available data) and Abstracts Views on Vision4Press platform.
Data correspond to usage on the plateform after 2015. The current usage metrics is available 48-96 hours after online publication and is updated daily on week days.
Initial download of the metrics may take a while.