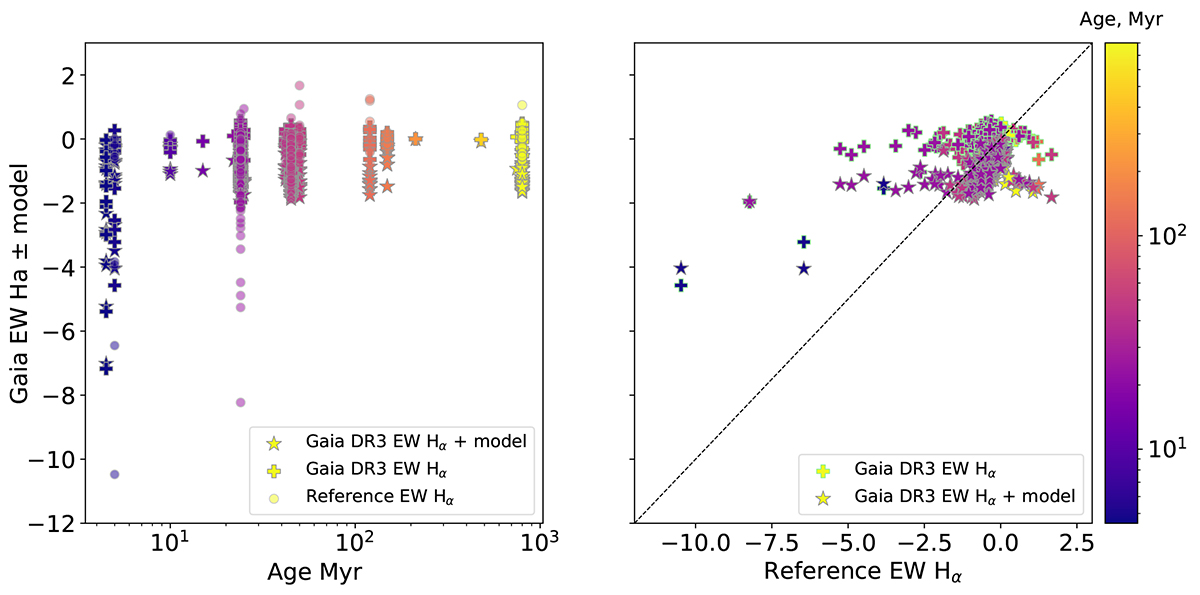
Fig. A.1.
Download original image
Comparison of EW Hα from Gaia DR3 and literature. Left panel: For the sample of stars, three values of equivalent width of Balmer α line were plotted according to Eq.A.1: Gaia DR3 EW Hα, Gaia DR3 EW Hα with added model and EW Hα found in literature. Right panel: the diagram presents the effect of the model from the relation described in Eq.A.1. Ages of the sample’s stars are colour-coded from youngest (blue) to oldest (yellow).
Current usage metrics show cumulative count of Article Views (full-text article views including HTML views, PDF and ePub downloads, according to the available data) and Abstracts Views on Vision4Press platform.
Data correspond to usage on the plateform after 2015. The current usage metrics is available 48-96 hours after online publication and is updated daily on week days.
Initial download of the metrics may take a while.