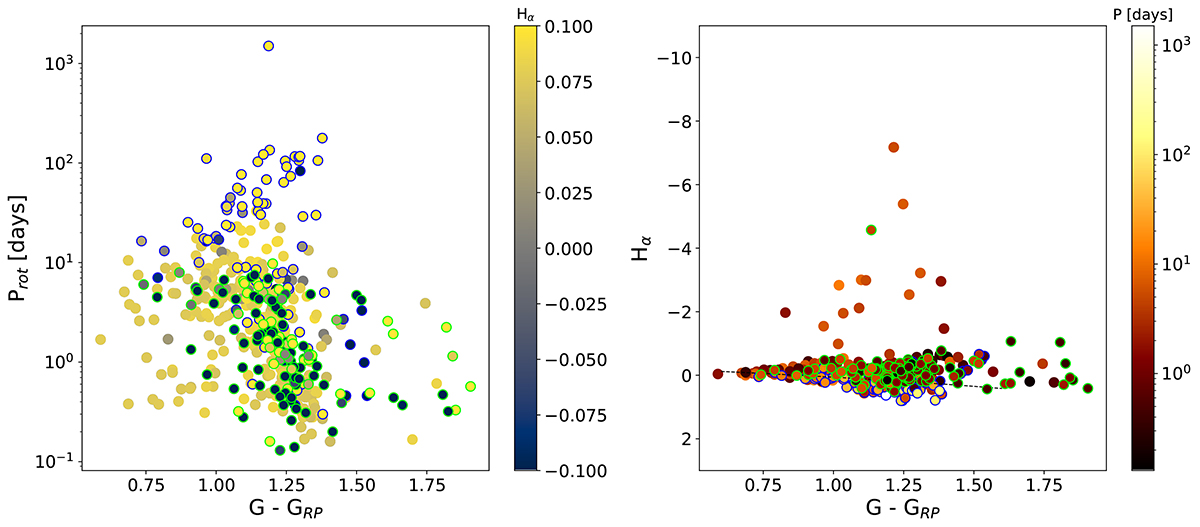
Fig. B.2.
Download original image
Plot of the relationship between Hα from Gaia DR3 including the model (see Eq. A.1) and logProt across (G - GRP)) colour from Gaia DR3, presented as a compliment our analyses in discrepancies between EW Hα measured by ESP-ELS in Gaia DR3 and the values reported in literature. Left: Rotation period distribution with (G - GRP)) colour-coded by normalised Hα equivalent width. Right: Hα equivalent width against (G - GRP), colour-coded by logProt. Stars with newly determined periods Prot are plotted as circles with lime-green edges, field stars in the sample are represented as circles with blue edges. The M-dwarf activity boundary plotted as dashed line follows Kiman et al. (2021)
Current usage metrics show cumulative count of Article Views (full-text article views including HTML views, PDF and ePub downloads, according to the available data) and Abstracts Views on Vision4Press platform.
Data correspond to usage on the plateform after 2015. The current usage metrics is available 48-96 hours after online publication and is updated daily on week days.
Initial download of the metrics may take a while.