Open Access
Fig. 1
Download original image
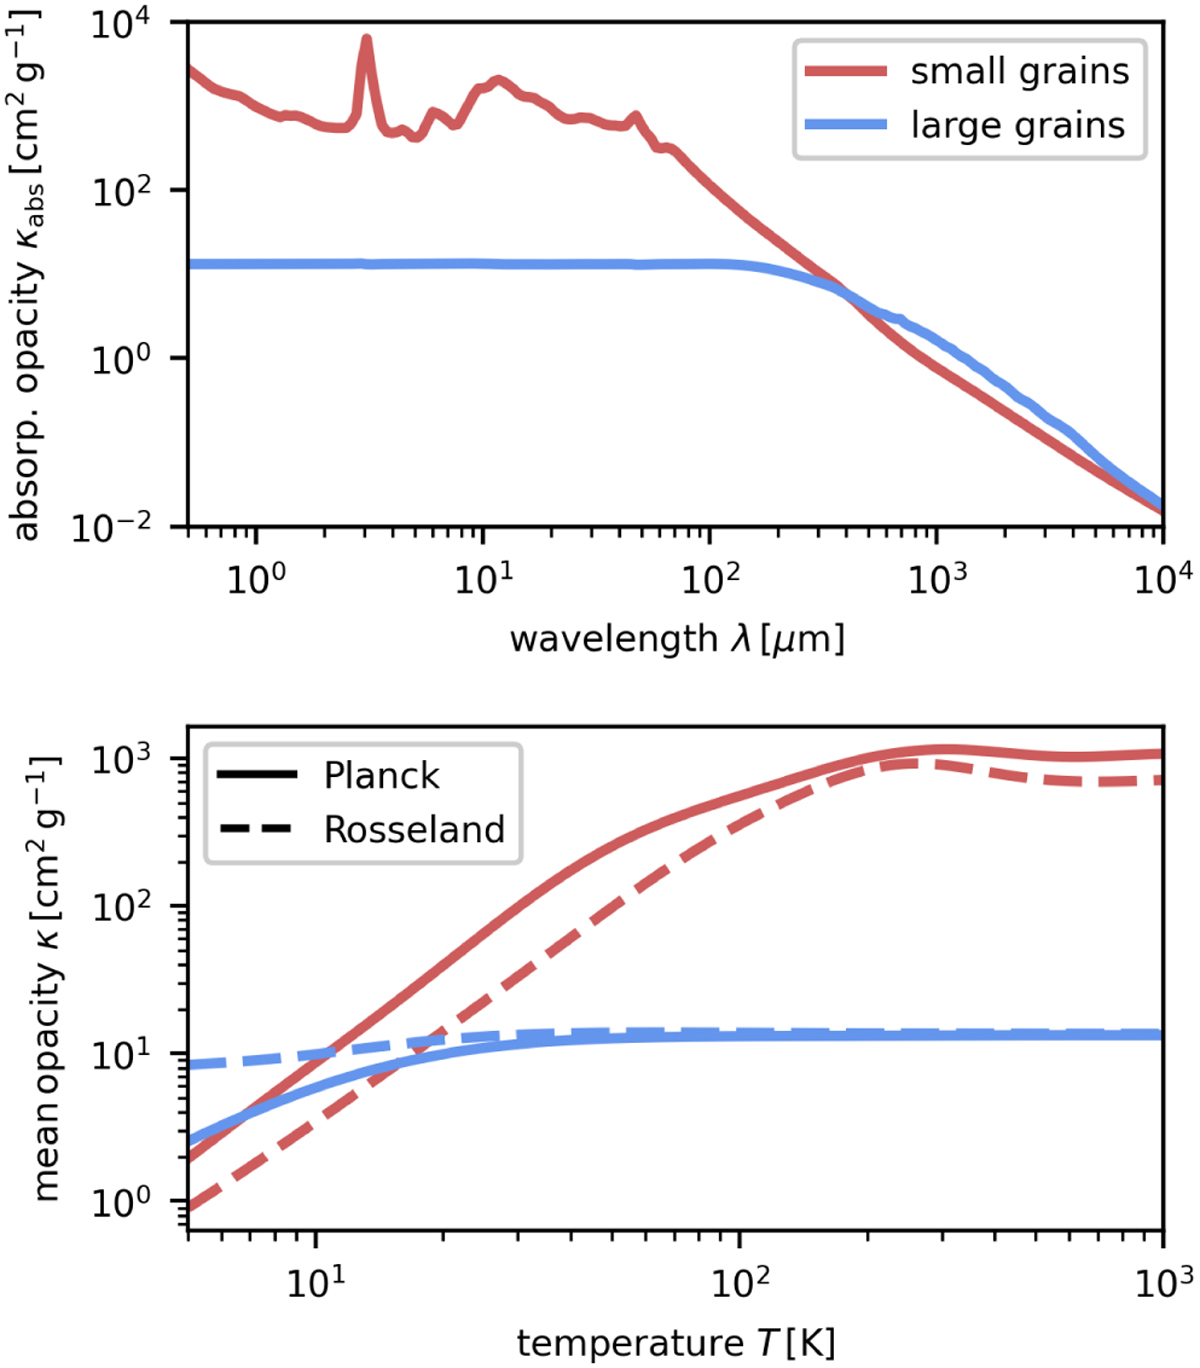
Absorption opacities as a function of the wavelength (top) and mean opacities as a function of the temperature (bottom) for populations of small (red; ![]() m) and large (blue;
m) and large (blue; ![]() mm) dust grains. In the bottom panel, the Planck and Rosseland opacities are shown as solid and dashed curves, respectively.
mm) dust grains. In the bottom panel, the Planck and Rosseland opacities are shown as solid and dashed curves, respectively.
Current usage metrics show cumulative count of Article Views (full-text article views including HTML views, PDF and ePub downloads, according to the available data) and Abstracts Views on Vision4Press platform.
Data correspond to usage on the plateform after 2015. The current usage metrics is available 48-96 hours after online publication and is updated daily on week days.
Initial download of the metrics may take a while.