Fig. B.1
Download original image
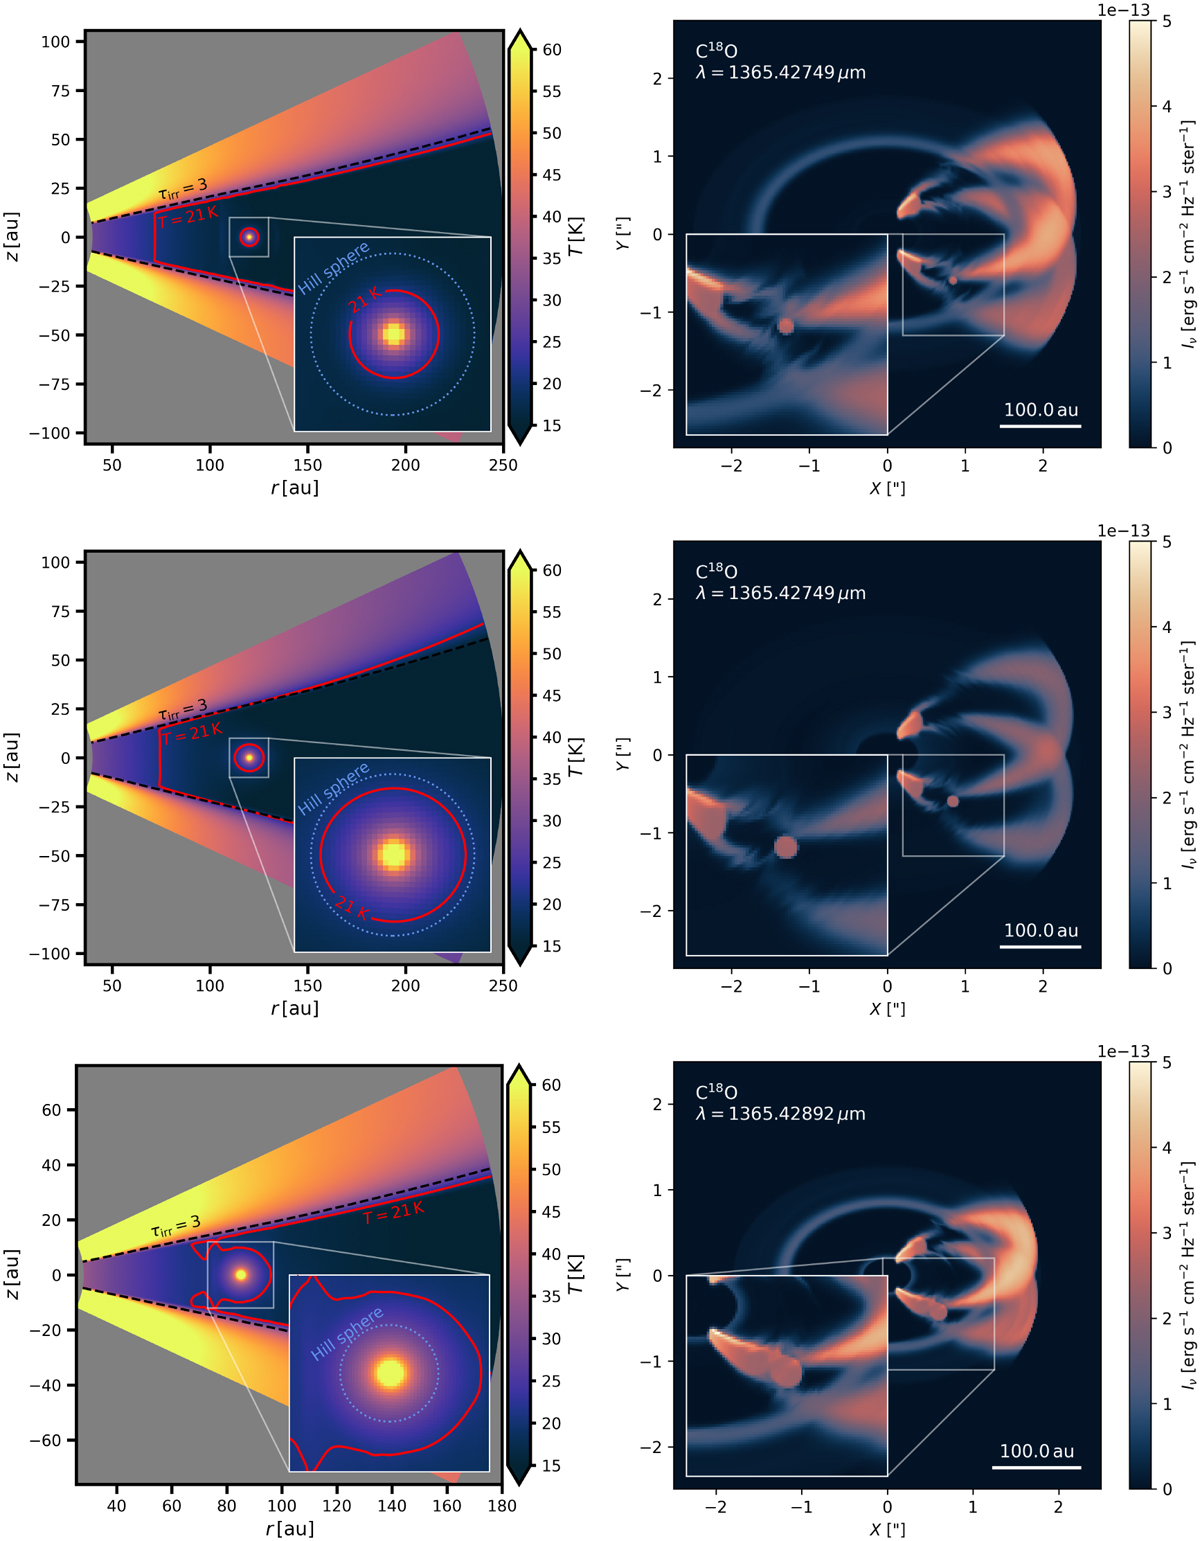
Meridional profiles of the disk temperature (left) and synthetic channel maps of C18O emission (right) for simulations S1 (top), S2 (middle), and S3 (bottom). Please note that the planet is shifted to 85 au in the bottom row. Therefore, the radial extent of the simulated disk, the wavelength of the synthetic image, and the centering of the inset differ from simulations S1 and S2.
Current usage metrics show cumulative count of Article Views (full-text article views including HTML views, PDF and ePub downloads, according to the available data) and Abstracts Views on Vision4Press platform.
Data correspond to usage on the plateform after 2015. The current usage metrics is available 48-96 hours after online publication and is updated daily on week days.
Initial download of the metrics may take a while.